If you’ve ever had to walk up a steep hill, or been faced with descent down a slippery ski slope, then you know that gradients are important. Suppose we are faced with a choice of walking up one of these two hills:
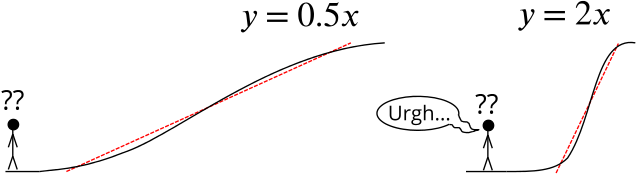
It’s pretty clear which one most of us would choose. We can tell just by looking that the hill on the right is much steeper than the hill on the left, and we all know from bitter experience that each step up its slope will be much harder work.
The gradient of a line or, more generally, a curve plotted on an \(xy\)-axes tells us how the change in the \(y\)-value of the curve depends on the \(x\)-value.
Suppose I give you a graph of how the distance I’ve travelled varies with time:
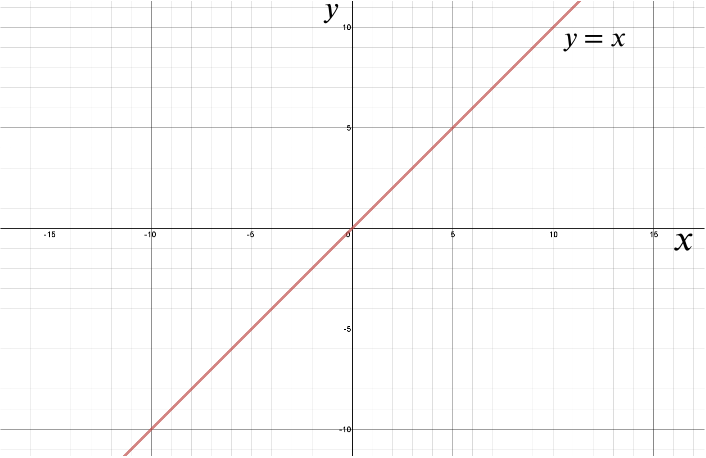
Here \(x\) denotes the time, and \(y\) the distance.
The gradient of slope of a straight line is simply the change in \(y\) over the change in \(x\). But the change in \(y\) of this line is the distance travelled and the change in \(x\) is how much time has passed, so \[\frac{\mbox{change in }y}{\mbox{change in }x} = \frac{\mbox{distance}}{\mbox{time}}\] which we all know is just my velocity. The gradient of a graph of distance versus time gives us the velocity.
Let’s look at a slightly more interesting example and consider the graph of how the height of a ball I’ve thrown straight up in the air changes with time:
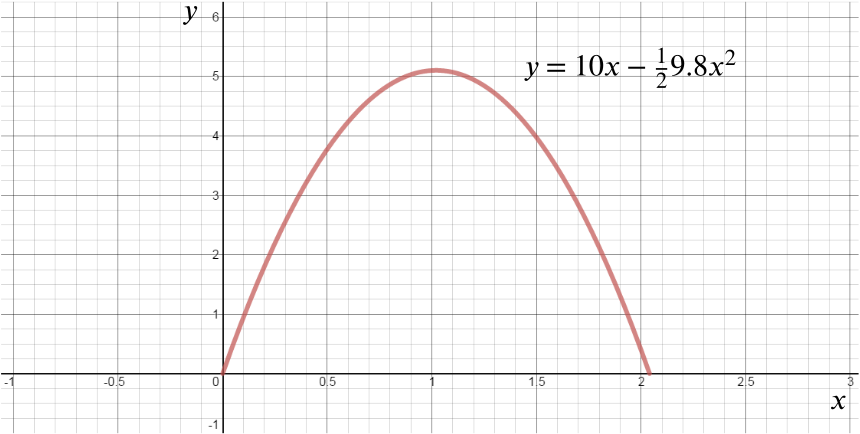
Again, \(x\) denotes the time and \(y\) the height.
We can see that the gradient of this curve, a parabola, changes over time. This represents how the velocity of our ball changes over time: it travels fastest (steepest positive gradient, sloping up from left to right) when it first leaves my hand, gradually slows down to almost a standstill at its highest point (a gradient of zero where it flattens out) and then speeds up as it falls back to Earth (reaching its the steepest negative gradient just as I catch it again, sloping down from left to right).
So we can plot how the velocity changes with time:
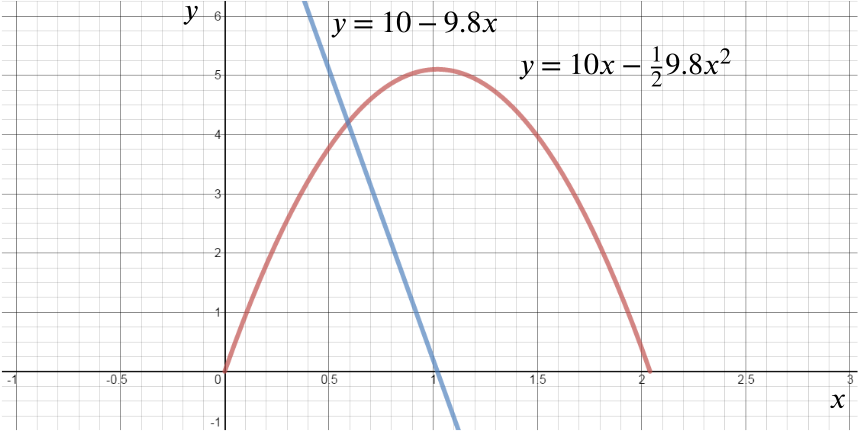
And the gradient of this straight line is:
\[\frac{\mbox{change in }y}{\mbox{change in }x} = \frac{\mbox{velocity}}{\mbox{time}}\]
which we know is the acceleration. So the gradient of the graph of velocity versus time gives us the acceleration, in this case, the acceleration due to gravity.
The gradient of any line or curve tells us the rate of change of one variable with respect to another. This is a vital concept in all mathematical sciences. As well as the rate of change of distance with respect to time (velocity), there is the rate of change of energy with respect to time (called power), the rate of change of chemical concentrations with respect to time (the rate of the reaction), and the rate of change of money owing with respect to time (compound interest). Any system that changes will be described using rates of change that can be visualised as gradients of mathematical functions.