Using a scale of \(\quantity{2}{cm}\) to one unit on each axis, draw the graph of \[y=6x-x^2\] for values of \(x\) from \(0\) to \(6\) inclusive.
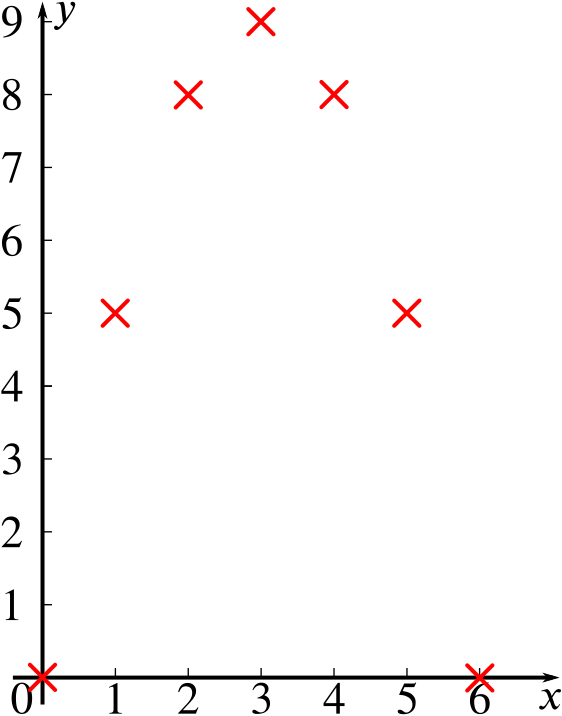
Let’s first draw our axes, allowing \(\quantity{2}{cm}\) per unit. We will plot the values of \(y\) for \(x=0\), \(1\), \(2\), \(3\), \(4\), \(5\), \(6\).
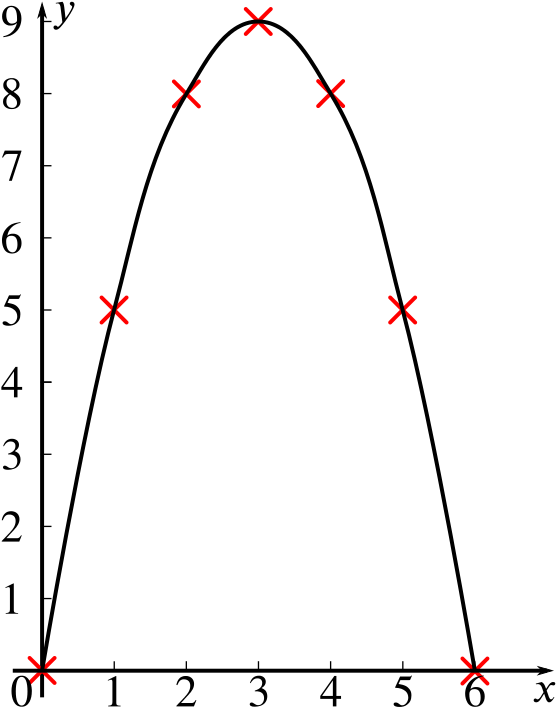
Now let’s join up the points as smoothly as we can.
Use your graph to solve the equation \[6x-x^2=7.\]
We’ll add the line \(y=7\) to our plot and see where it intersects the curve.
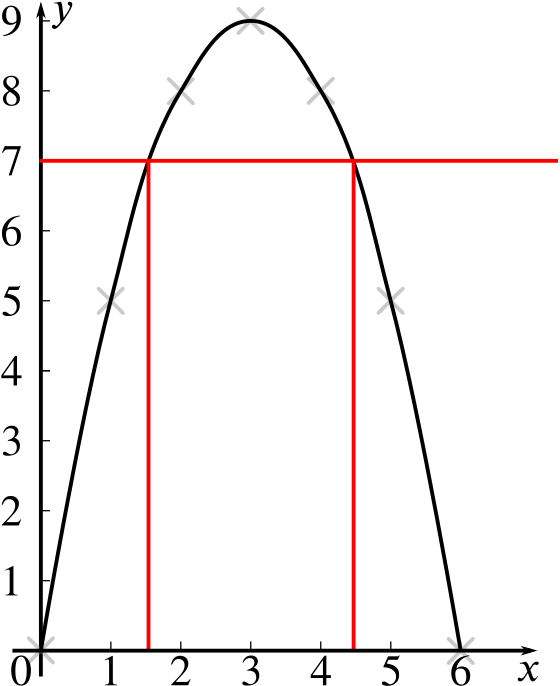
We read off the approximate solutions. From our plot, we see that \(x\approx 1.6\) and \(x \approx4.4\) solve \(6x-x^2=7\).
Using the quadratic formula to solve this equation gives \(x\approx 1.586\) and \(x \approx4.414\).
By adding a suitable straight line to your graph, solve the equation \[6x-x^2=8-\tfrac{1}{2}x.\]
Let’s now add the line \(y=8-\frac12 x\) to our sketch, making sure to plot at least \(3\) points so that we draw it accurately.
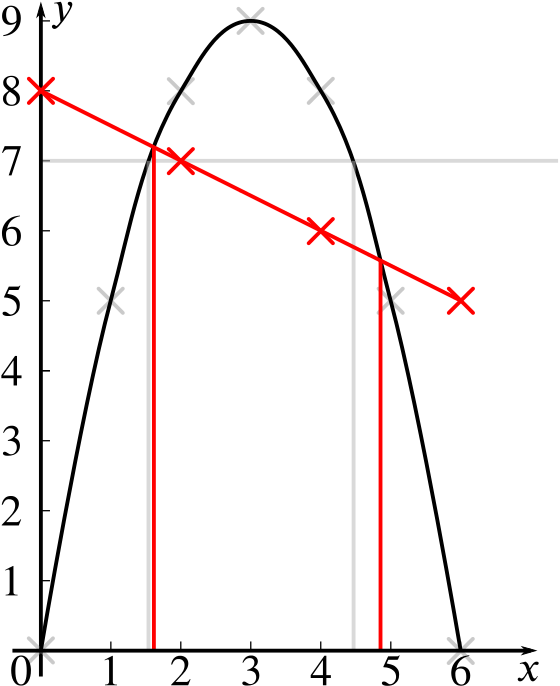
We can see from our plot that the smaller solution of \(6x-x^2=8-\frac12x\) is slightly larger than the smaller solution of \(6x-x^2=7\), and the larger solution is larger than the larger solution of \(6x-x^2=7\).
Our graph tells us (your grid will help you) that the solutions of \(6x-x^2=8-\frac12x\) are \(x\approx 1.6\) and \(x\approx 4.9\).
Using the quadratic formula to solve this equation gives \(x\approx 1.649\) and \(x \approx4.851\).