An engineering firm makes two types of tractor, the ‘Rome’ and the ‘Brussels’. The number of each made per week is limited by storage capacity on site, the number of workers employed and manufacturing costs, as detailed below:
The maximum total storage capacity for a week’s production is for \(10\) tractors. However, there is not enough room to store more than \(8\) Brussels tractors from any week’s production and, in order to meet demand, at least \(3\) Rome tractors must be made each week.
In any given week, \(5\) workers are required to make one Rome tractor and \(2\) are needed to make one Brussels tractor. There are \(40\) workers altogether, but not all of them have to be used. It costs \(£16\,000\) to make a Rome tractor and \(£12\,000\) to make a Brussels tractor. A total of \(£144\,000\) is available each week.
- Using the symbols \(R\) for the number of Rome and \(B\) for the number of Brussels tractors made per week, write down \(5\) inequalities arising from the information above.
Let’s go through the description line by line.
The maximum total storage capacity for a week’s production is for \(10\) tractors.
So we can’t produce more than \(10\) tractors per week. This means that \[ R+B\le 10. \]
However, there is not enough room to store more than \(8\) Brussels tractors from any week’s production and, in order to meet demand, at least \(3\) Rome tractors must be made each week.
So we can’t make more than \(8\) Brussels tractors, i.e., \[ B\le 8, \] and we must make more than \(3\) Rome tractors, i.e., \[ R\ge 3. \]
In any given week, \(5\) workers are required to make one Rome tractor and \(2\) are needed to make one Brussels tractor. There are \(40\) workers altogether, but not all of them have to be used.
This tells us that the total number of workers per Rome tractor and the total number of workers per Brussels tractor must not exceed \(40\). Mathematically, this means that \[ 5R+2B\le 40. \]
It costs \(£16\,000\) to make a Rome tractor and \(£12\,000\) to make a Brussels tractor. A total of \(£144\,000\) is available each week.
So the money the Rome tractors cost and the Brussels tractors cost cannot exceed \(£144\,000\) per week. In other words, \[ 16000R+12000B\le 144000. \]
There are also two further inequalities implied by the situation: we cannot make a negative number of tractors, so we must have \[R\ge0\quad\text{and}\quad B\ge0.\] In this case, the first of these is already implied by \(R\ge3\), but the second is not. In general, it is worth being explicit about this sort of restriction.
- Illustrate these inequalities on a graph in which the horizontal axis represents the number of Rome tractors made per week and the vertical axis represents the number of Brussels tractors made per week. Show the feasible region clearly.
We should bear in mind that although we will be drawing continuous straight lines, there is an implicit assumption that the firm makes whole tractors: they are not making \(2.743\) Brussels tractors, for example. So at the end, we will only be interested in those points with integer coordinates which lie within the feasible region.
Let’s first draw a set of suitable axes to work on. We should use graph paper to answer this question if possible.
There are two sensible ways to decide on suitable axes:
Work out where each of the lines representing the inequalities will meet the axes, and then draw axes large enough for these.
Note that as they can’t make more than \(10\) tractors in total each week, it follows that \(R\le 10\) and \(B\le 10\). So drawing both axes from \(0\) to \(10\) will certainly allow us to show the feasible region.
Our axes will have \(R\) from \(0\) to \(10\) and \(B\) from \(0\) to \(20\), so that all of the non-horizontal lines meet both axes on our graph, but this is not required.
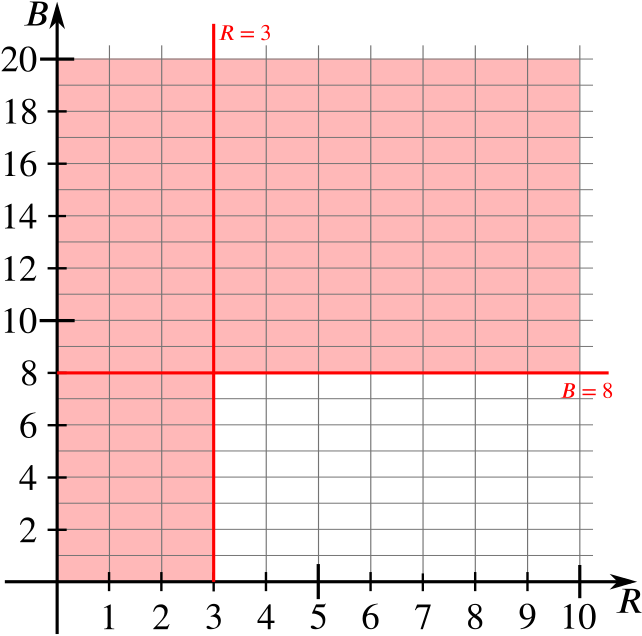
Let’s start with the simplest inequalities: \(R\ge 3\) and \(B\le 8\). First, we draw the lines \(R=3\) and \(B=8\) and shade the excluded regions.
Next, we’ll add in the inequality \(R+B\le 10\). We want our diagram to be accurate, so let’s check where the line \(R+B=10\) intersects the lines we already have. When \(R=3\), \(B=7\), and when \(B=8\), \(R=2\). So we expect \(R+B=10\) to cross below the intersection point of \(R=3\) and \(B=8\) like this:
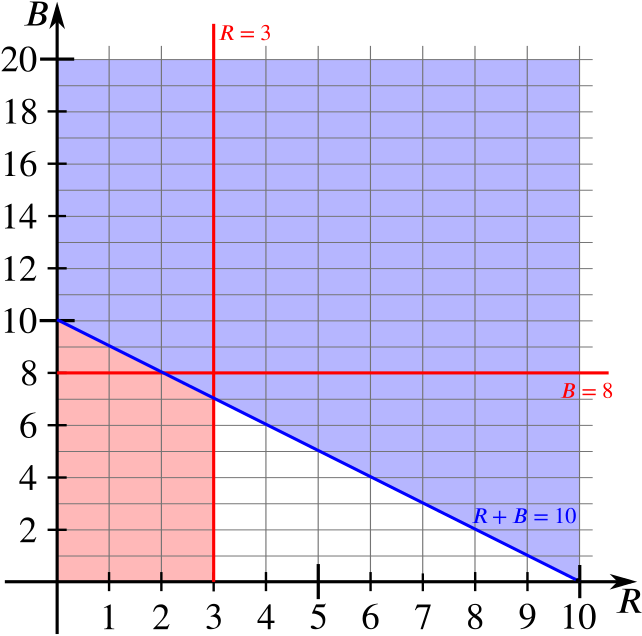
Again, we’ve shaded the new excluded region.
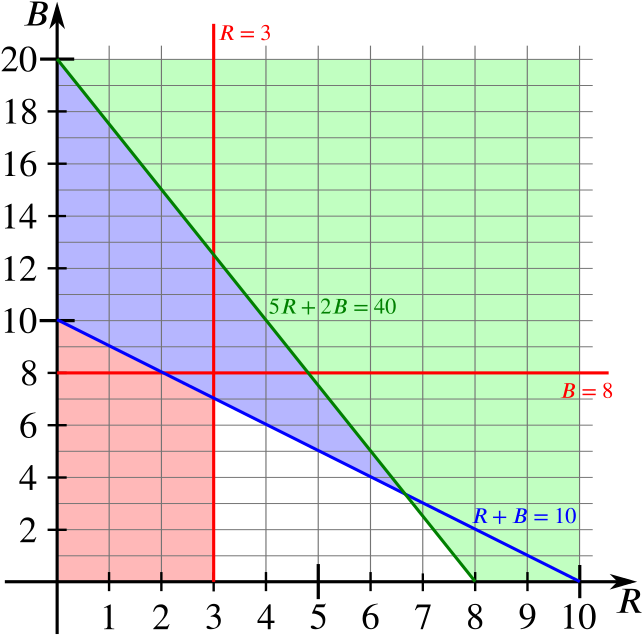
Now let’s add in \(5R+2B\le 40\). We see that \(5R+2B=40\) intersects the \(R\)-axis (\(B=0\)) when \(R=8\), and the \(B\)-axis at \(B=20\). (If we only drew our axes up to \(B=10\), we would find \(R=4\) when \(B=10\), and use that to draw our line.) So our diagram now looks like this:
Finally, let’s add in the inequality \(1600R+1200B\le 144000\). These numbers are quite large, so let’s divide the inequality through by \(4000\) to simplify it to \(4R+3B\le 36\) instead. The line \(4R+3B=36\) intersects \(R\)-axis at \(R=9\) and the \(B\)-axis at \(B=12\). (And it intersects the line \(B=10\) at \(R=1.5\).)
With all the lines and shaded regions, our final diagram looks as follows:
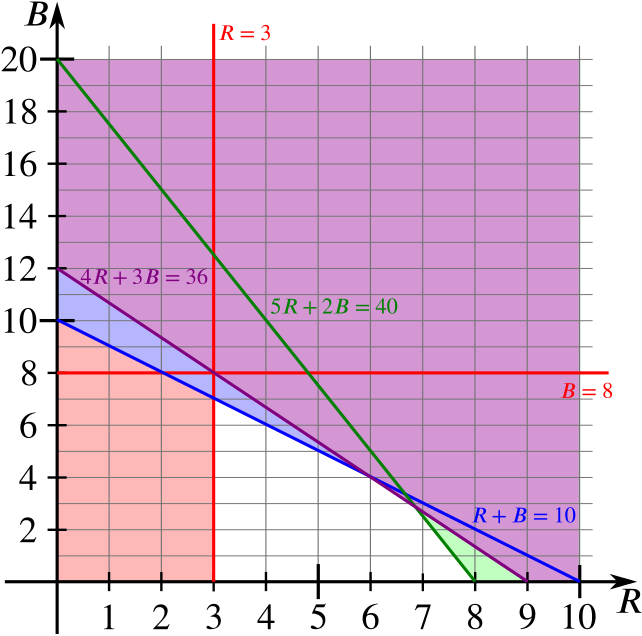
The feasible region is the region which remains unshaded (and lies on or above the \(R\)-axis).
- The profit on one Rome tractor is \(£3\,000\) and the profit on one Brussels tractor is \(£2\,000\). Find the number of each type which should be made weekly in order to maximise the profit, and find the maximum profit.
We know that \(R\) and \(B\) must be whole numbers, so we can use our diagram to find all possible solutions, by working out what the profit is for each possible grid point and find the largest value. The profit is \(£1000(3R+2B)\), so we need only calculate \(3R+2B\) at each point. Clearly, for each possible value of \(R\), we only need to calculate \(3R+2B\) for the greatest possible value of \(B\).
So we check the points \((R,B)=(3,7)\), \((4,6)\), \((5,5)\), \((6,4)\), \((7,2)\) and \((8,0)\).
An alternative method for finding the maximum profit is to draw the line \(3R+2B=c\) on our diagram for some value of \(c\). Now using a ruler (or plotting the problem in Desmos or GeoGebra and using a slider), move the ruler while keeping its gradient constant so that the edge of the ruler represents the line \(3R+2B=c\) as \(c\) increases. We want to find the largest possible \(c\) at an integer point before we leave the feasible region.
For our problem, the maximum profit is earned at the point \((6,4)\), with the profit \(£3\,000\times 6+£2\,000\times 4=£26\,000\).