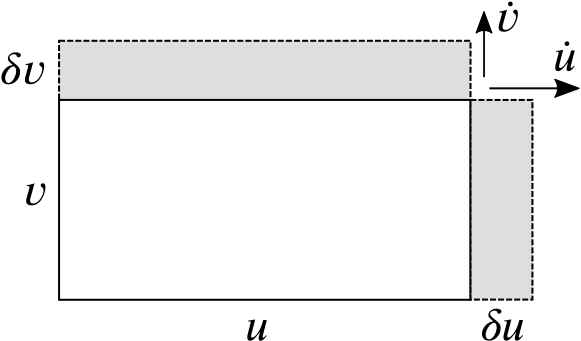
This white rectangle has width \(u\) and height \(v\), both of which vary as functions of time, \(t\). We can write the rates of change as \(\dot{u}\) and \(\dot{v}\).
| The area of the white rectangle, \(A=\) | |
| In a short time interval, \(\delta t\), we can assume that \(\dot{u}\) and \(\dot{v}\) are roughly constant, so… | |
| The width increases by \(\delta u =\) | |
| The height increases by \(\delta v =\) | |
| The area increases by approximately the shaded area, so \(\delta A \approx\) | |
| The rate of change of the area of the rectangle, \(\dfrac{dA}{dt} \approx \dfrac{\delta A}{\delta t} \approx\) | |