Underneath are some unusual looking graphs. Try to describe each graph in words. What features do you notice?
How did you describe the features of the graphs? Did you use mathematical language to help you?
Did you use shapes or equations to describe different sections?
If you did this in a group, were certain graphs drawn more accurately than others? If so, what was different about the way they were described?
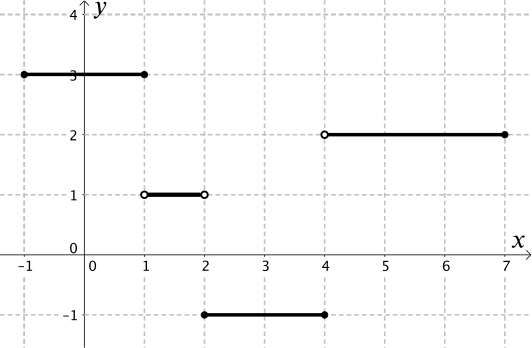
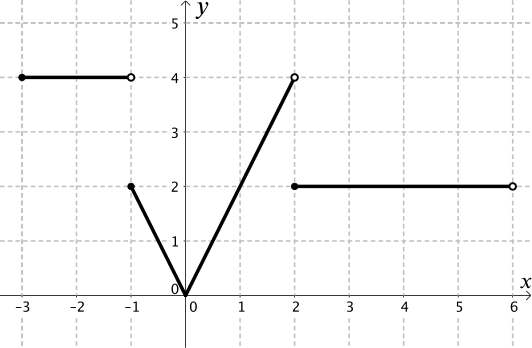
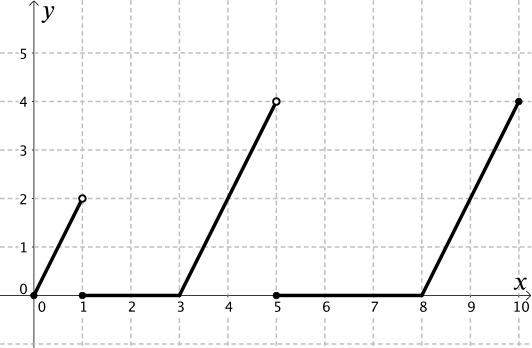
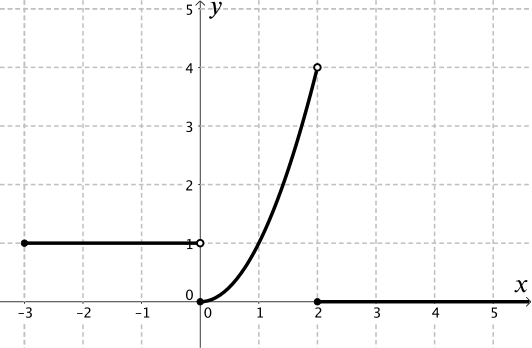
These are all graphs of piecewise functions. The whole function \(f(x)\) is made up of differing sections (or pieces).
Now you have described and sketched the functions, can you write their equations? The way they were described might help you with this. You can check your answers in the taking it further section.