In Curve match we asked you to match the curves on the diagram below with the following functions.
\[ y=\sqrt{x} \quad y=x^2 \quad y=x \quad y=\dfrac{x^2+x}{2} \quad \text{and } \quad y=2\sqrt{x}-x\]
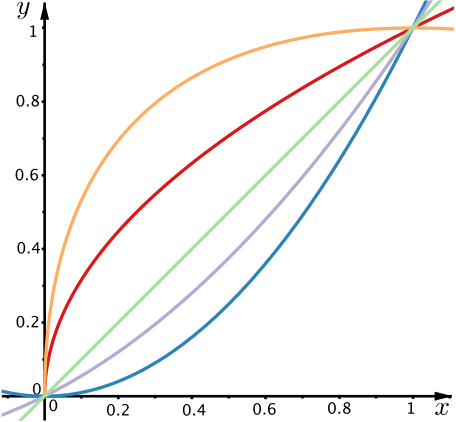
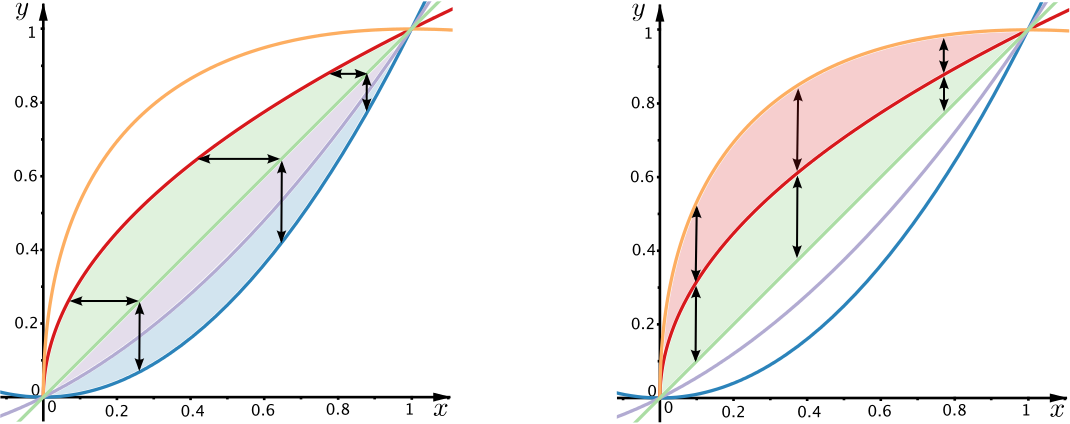
Now we’d like you to look at the different regions enclosed by the curves.
- Which do you think is the smallest region? How can you check?
Think about what techniques you can use and how you can reduce the number of calculations you need to do.
It looks as if the region between \(y=\dfrac{x^2+x}{2}\) and \(y=x^2\) or the region between \(y=x\) and \(y=\dfrac{x^2+x}{2}\) could be the smallest, but it’s difficult to tell which is smaller just by looking.
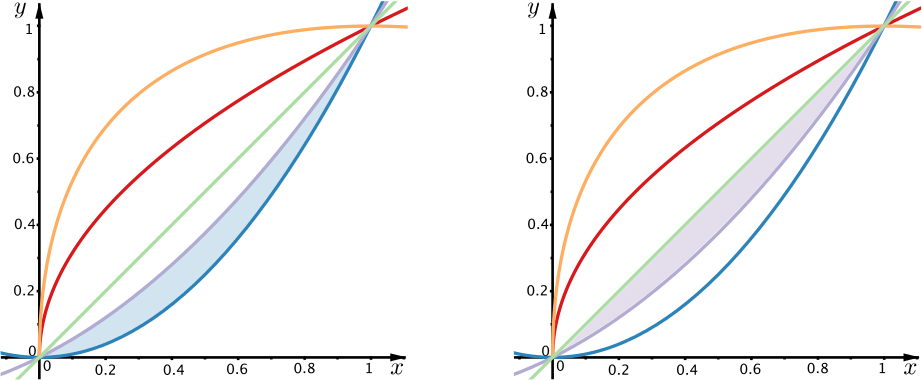
One way to check which region is smaller is to use integration to find the areas. In order to find the area enclosed by \(y=\dfrac{x^2+x}{2}\) and \(y=x^2\) we could first find the area under \(y=\dfrac{x^2+x}{2}\), the upper boundary of the region, and subtract the area under the \(y=x^2\), the lower boundary of the region we want. However, because integration is linear, we could instead integrate the difference beween the two functions, as follows.
\[\int_{0}^{1} \dfrac{x^2+x}{2} -x^2\, dx = \int_{0}^{1} \dfrac{x-x^2}{2}\, dx = \int_{0}^{1} \dfrac{x}{2}-\dfrac{x^2}{2}\, dx = \left[ \dfrac{x^2}{4}-\dfrac{x^3}{6}\right]_{0}^{1} = \left(\dfrac{1}{4}-\dfrac{1}{6}\right) = \dfrac{1}{12}\]
Similarly, the area of the region between \(y=x\) and \(y=\dfrac{x^2+x}{2}\) is given by
\[\int_{0}^{1} x-\dfrac{x^2+x}{2}\, dx = \int_{0}^{1} \dfrac{x-x^2}{2}\, dx\]
What does this tell you? Can you explain it?
How big are the other regions?
Try to explain why certain regions are the size they are.
You may have found that the areas of regions in the diagram can be found in several ways. We will illustrate a few of these here.
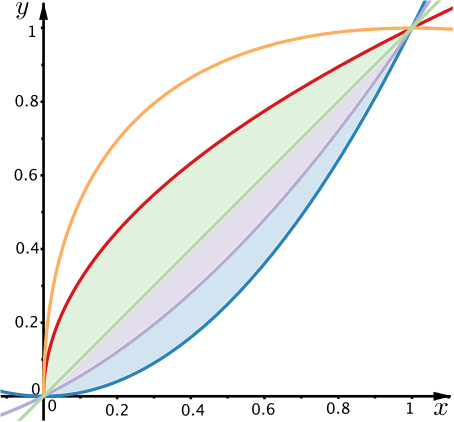
It is worth noting that by using symmetry in various forms we have been able to find the areas of all the regions enclosed by the curves by only doing one integral.
Would we still be able to do this if we started by finding a different integral?
Further things to investigate
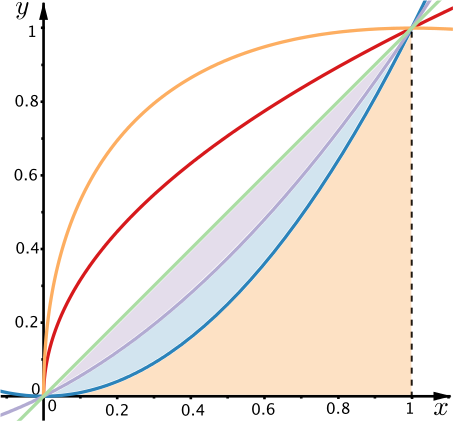
The area of the region between \(y=x^2\), the \(x\)-axis and the line \(x=1\) is \(\tfrac{1}{3}.\) Can we find a function whose graph splits this region into areas of \(\tfrac{1}{6}\)?
Can you find other functions whose graphs pass through \((0,0)\) and \((1,1)\) and bound regions of area \(\tfrac{1}{12}\)?
The curves in this problem all pass through \((0,0)\) and \((1,1).\) This made calculating the definite integrals quite simple. How do you think our use of symmetry, means and composite shapes would have been affected if the curves didn’t all meet at these points? What if we only wanted to know about regions from \(x=0\) to \(x=\tfrac{1}{2}\)?