Averaging crops up all over the place in mathematics. We are familiar with the idea of finding an average of some data (indeed, we have more than one type of average that we can use), but there are many other contexts where what we are essentially doing is finding an average. Often we don’t explicitly describe it in that way, but being alert to the connection can be very helpful.
In statistics, you will have met various averages that represent large datasets in different ways. They are all ways of expressing a centre for the data. Similarly, we might be interested in the centres of mass of certain objects, including triangles, the midpoints of line segments, or the mean value of a function. There are other kinds of average that crop up during A level mathematics.
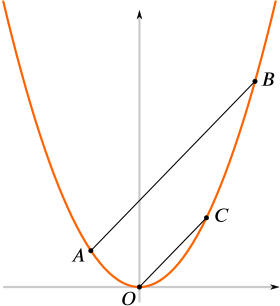
One particular average that you may have met is finding the midpoint of the line segment joining two points on a coordinate plane. If these points are constrained in some way, for instance, if their coordinates satisfy an equation of a curve, then we can start to link averages to chords of curves. For example, a lot of ideas relating to averages arise in Parabella.

Because averages give us a way to express some sort of centre, we can relate averages and Symmetry. For example, the turning point of the parabola \(y=ax^2+bx+c\) occurs at the \(x\)-value that is the mean of the two roots. Is the same kind of reasoning true for cubics and if not, why not?
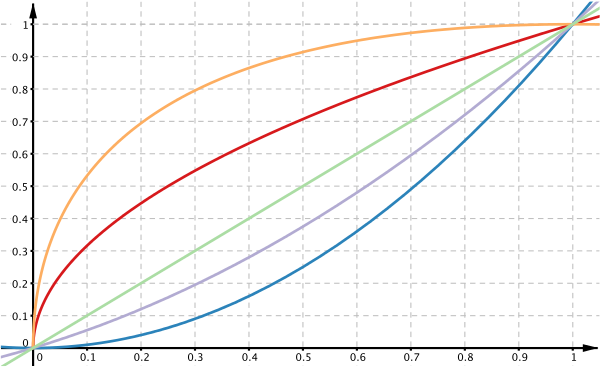
We can use averages when thinking about functions or functions when we are thinking about averages. An example of this thinking arises in Curve match where we are given the graphs and equations of five functions, asked which curve is which, and then asked to find further functions whose graphs lie between the given curves.

When dealing with functions that are not straight lines we often use numerical methods that depend on ‘smoothing out’ sections of the curve by using the notion of average. For example, if we join two points on a distance time graph with a straight line we are representing average speed; it says ‘we got from one point to the other in the same time interval as was represented by the curve’. Thus we can find an average rate of change of a curve without knowing all the intervening values. You can explore this in Average speed. There is an important theorem - the Mean Value Theorem - which says that there must be a point on the graph (so long as the graph is continuous and smooth) where the gradient of the tangent is the same as this average rate. You might like to test this out visually with a variety of functions.
Averages also appear as the sum of the terms of an AP (the sum is the number of terms times the average of the first and last term) and similarly the area of a trapezium is the average of the lengths of the parallel edges times the distance between them. You can use this to find the area of regions in the plane, such as those in Between the lines or to approximate areas bounded by curves. This can be explored in Is the Serpentine Lake really 40 acres? or Underneath the arches.

Here we see that the trapezium rule can give us an exact value for the integral or area between the graph and the \(x\)-axes, and then we can ask what this is telling us about integrals and average values of functions.
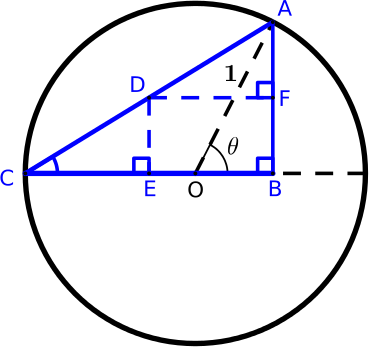
When thinking about functions and identities, a graphical interpretation may help to reinforce the results or suggest an alternative way to prove a result. For example, averages and midpoints can be exploited in Inspecting identities and Proving the half-angle formulae.

These resources mainly make use of the arithmetic mean, but you may notice the geometric and harmonic mean also appearing. The inequality relating the arithmetic mean and geometric mean can sometimes be used instead of using calculus to solve optimisation problems, such as finding the minimum value of \(x+\tfrac{1}{x}\) in Domain and range dominoes and in many Review questions including Can we prove the Arithmetic and Geometric Mean Inequality? and Proving and using the \(t\)-formulae.
Averages is one of the ideas that we have chosen to highlight in our pervasive ideas.

