Sketch, on separate diagrams, the curves \[\text{(i)}\ y=\frac{x-a}{x},\qquad \dots\] where \(a\) is a positive constant.
[The equations of any asymptotes should be stated, together with the coordinates of any intersections with the axes.]
When sketching curves, a useful strategy in many cases is to see if the function can be written in terms of other functions whose graphs we already know.
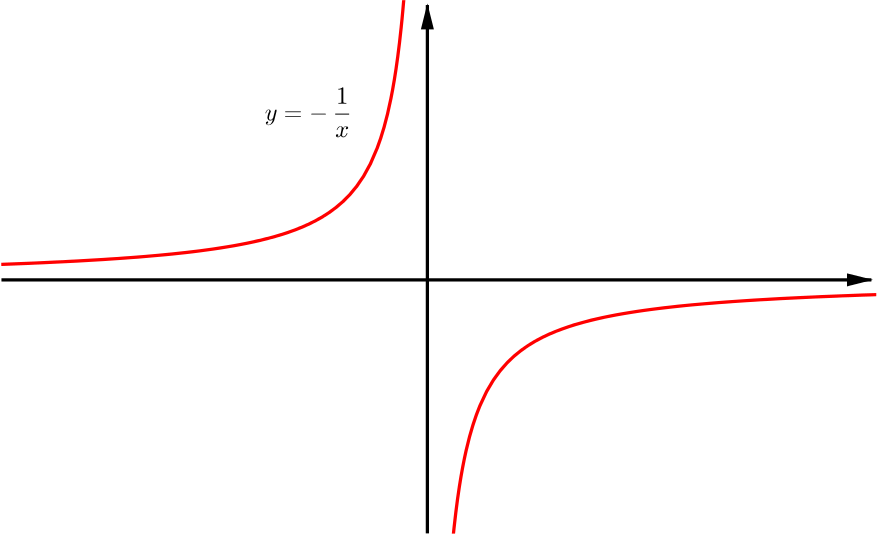
In this case, we can start by considering the graph of the basic function \(\frac{1}{x}\). It has a vertical asymptote at \(x=0\) and a horizontal asymptote at \(y=0\).
We will now try to manipulate this curve until we obtain the graph of equation \(\eqref{eq:1}\). Multiplying the curve by \(-1\) is a reflection in the \(x\)-axis. This gives us the curve \(y=-\frac{1}{x}\), as shown below. We note that the equations of the asymptotes are the same in this case.
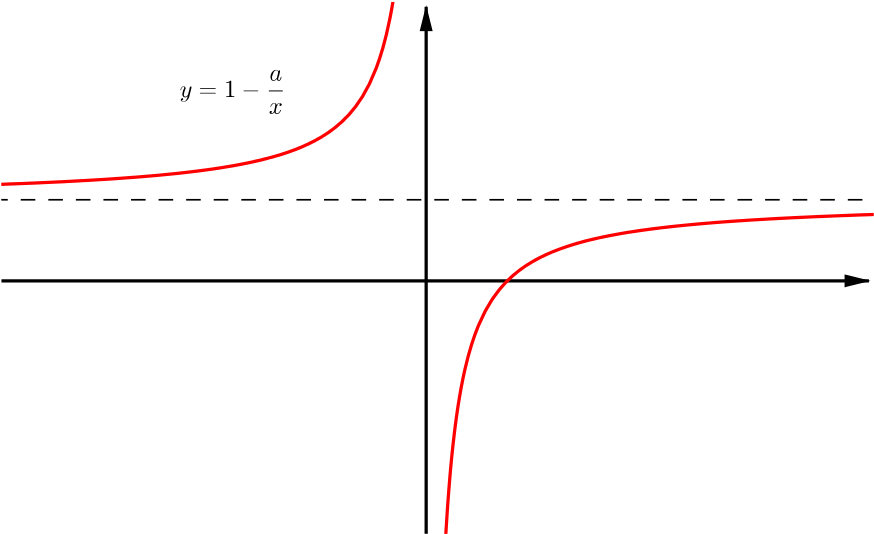
Next we consider multiplication by \(a\). As \(a\) is a positive constant, this can be interpreted as a stretching in the \(y\)-direction by a factor of \(a\) and so only has the effect of changing the scale on the graph.
We now note that addition by a constant is equivalent to a shift of its graph in the \(y\)-direction. In the sketch below we see the graph of \(y=1-\frac{a}{x}\), as required. The asymptotes are also translated by \(1\) in the \(y\)-direction and so the equations of the new asymptotes are \(y=1\) and \(x=0\). We also note that the curve intersects the \(x\)-axis when \(x=a\), by substituting \(y=0\) into the equation.
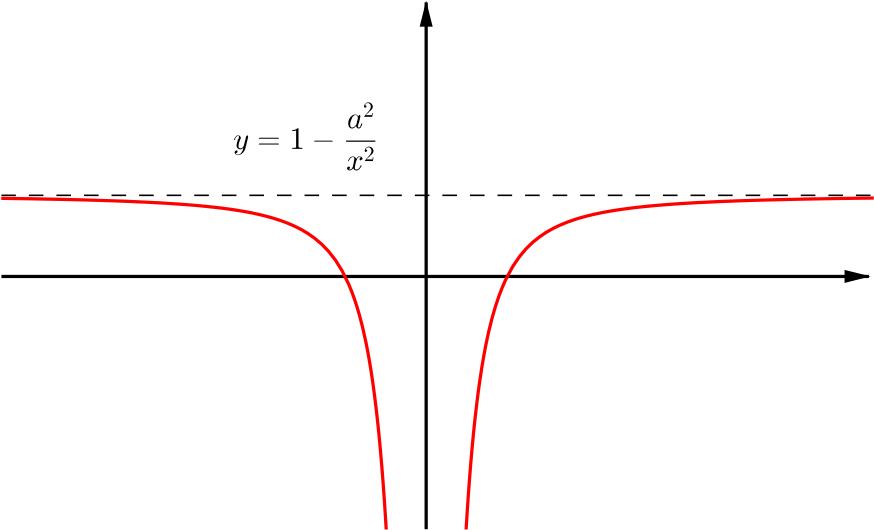
Sketch, on separate diagrams, the curves \[\dots,\qquad \text{(ii)}\ y=\frac{x^2-a^2}{x^2},\] where \(a\) is a positive constant.
[The equations of any asymptotes should be stated, together with the coordinates of any intersections with the axes.]
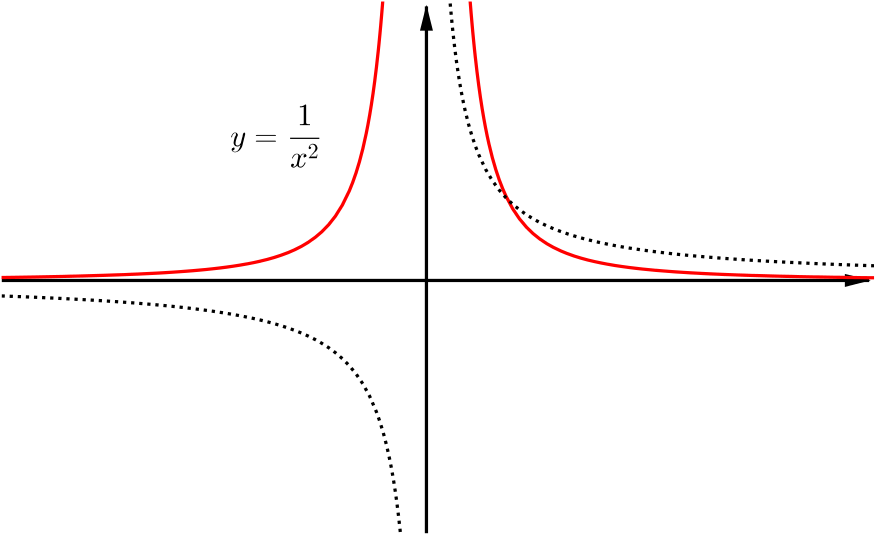
Similarly to before, we aim to sketch the graph of \(y=\frac{1}{x^2}\) and then use tranformations until we obtain the graph of equation \(\eqref{eq:2}\).
We know that the graph of \(y=\frac{1}{x^2}\) must be similar to that of \(y=\frac{1}{x}\), with smaller values increasing their distance from the \(x\)-axis and larger values decreasing their distance from the \(x\) axis. The \(y\) values are also positive and so any negative parts of the graph are reflected upwards in the \(x\)-axis.
Multiplication by \(-a^2\) is a reflection in the \(x\)-axis followed by a stretch by a factor of \(a^2\) in the \(y\) direction.
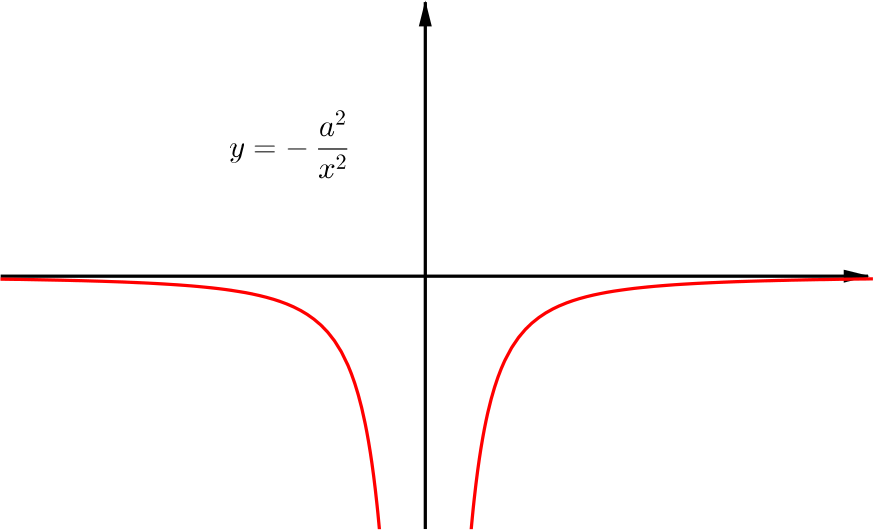
Finally, addition by \(1\) shifts the graph upwards by one unit. We also note that the curve intersects the \(x\)-axis at the points \(x=a\) and \(x=-a\), by substituting \(y=0\) into equation \(\eqref{eq:2}\). Similarly to before, our final asymptotes are also shifted upwards by one unit and so are \(y=1\) and \(x=0\).
Is there a way to use the graph of \(y=\frac{x-a}{x}\) to sketch this curve directly?