Please don’t read these notes until you have tried the problem for yourself!
Here are some brief and informal notes on things that you might have noticed having worked with the interactivity and having tackled the questions suggested.
Given two positive integers, can you draw the corresponding diagram?
We pick two numbers, say \(a\) and \(b\), and draw a rectangle with those side lengths. Say \(b\) is the shorter side. Then we chop off as many \(b \times b\) squares as possible, working from one end of the rectangle, to leave a new \(b \times c\) rectangle (where \(c\) must be less than \(b\), or we’d be able to chop off another \(b \times b\) square). Then we chop off as many \(c \times c\) squares as possible, working from one end of the rectangle. We keep repeating this process for as long as possible.
At this point, we might ask ourselves whether the process always stops (terminates), or whether we might continue chopping off squares forever.
Given a diagram, can you determine the corresponding pair of positive integers?
One way to think about this would be to start from the smallest square, and use that to determine the side lengths of the full rectangle. But we’re not told the side length of the smallest square, so we start to see that the diagram does not uniquely determine the starting numbers.
A bit of thought shows that if we double both the original numbers, then we get the same diagram (except possibly magnified). In fact, there are infinitely many pairs of numbers that give the same diagram. We see that what matters is the ratio \(a/b\) of the initial numbers \(a\) and \(b\), rather than their absolute values.
What is the relationship between the side length of the smallest square in the diagram and the pair of positive integers?
This is very fertile ground for investigation!
A bit of experimentation might suggest that the side length of the smallest square is the highest common factor of the two starting numbers. Then the challenge is to prove that.
One helpful way to think about this can be to think about it being in two parts:
show that the side length of the smallest square divides both starting numbers (it is a common factor);
show that any common factor of the starting numbers must divide the side length of the smallest square (it’s the highest common factor).
Then there are various approaches. One possibility is that we use the diagram to do each of those tasks (sometimes it helps to think of the diagram as representing a tiling of a bathroom wall, where we want all the tiles to have the same size so the size must divide the side length of the smallest square). Another possibility is to use a different representation, interpreting the question using equations, as discussed below.
How many steps (different colours) can we have? Which pairs of integers give many steps and which give few?
One way to approach this would be to start from the end and work backwards: rather than thinking of two numbers and seeing how many steps they need, start with the last bit of the diagram and build it up backwards (by repeatedly adding on squares) until it has the desired number of steps.
It’s interesting to think about which numbers this yields, if we try to use as many different colours as possible (so just one square of each colour).
How can we record the information from the diagram in the form of equations?
When might the diagram be more convenient? When might the equations be more convenient?
The conventional way to do this is as follows. Here is the image corresponding to \(197\) and \(113\).
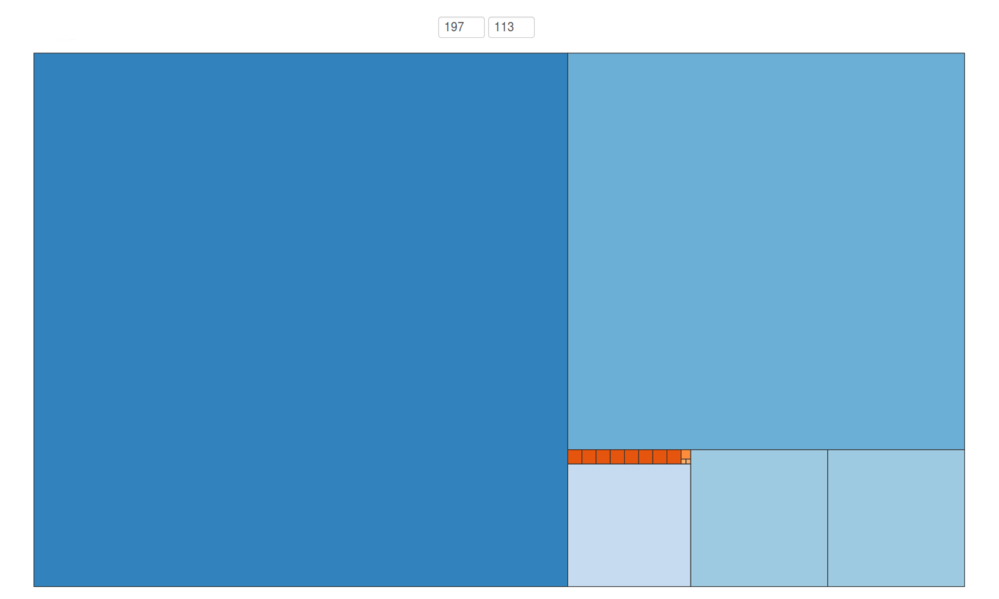
And here are the equations.
\[\begin{align*} 197 &= 1 \times 113 + 84\\ 113 &= 1 \times 84 + 29\\ 84 &= 2 \times 29 + 26\\ 29 &= 1 \times 26 + 3\\ 26 &= 8\times 3 + 2\\ 3 &= 1\times 2 + 1\\ 2 &= 2\times 1. \end{align*}\]Can you see the (many) connections between the diagram and the equations?
What is the point of the process captured by this diagram? What is it useful for? When might it be more or less useful than our existing techniques?
The process recorded in the diagram (or in the collection of equations as above) is known as Euclid’s algorithm, and it is useful for finding the highest common factor of two numbers.
How else might you find the highest common factor of two numbers? Try out your existing idea(s) on the numbers \(329\) and \(49\), and then try Euclid’s algorithm. Which is faster? Which is easier? Which do you prefer? What if the numbers were larger?