We graphed the following three pairs of equations, all on the same axes.
\(x + y - 1 = 0\) and \((x + y - 1)(x^2 + y^2) = 0\)
\(x + y = 0\) and \((x + y)(y^2 + (x+1)^2) = 0\)
\(x + y = 1\) and \(x^3 + 3xy + y^3 = 1\)
To our surprise, we could only see two lines on the graph.
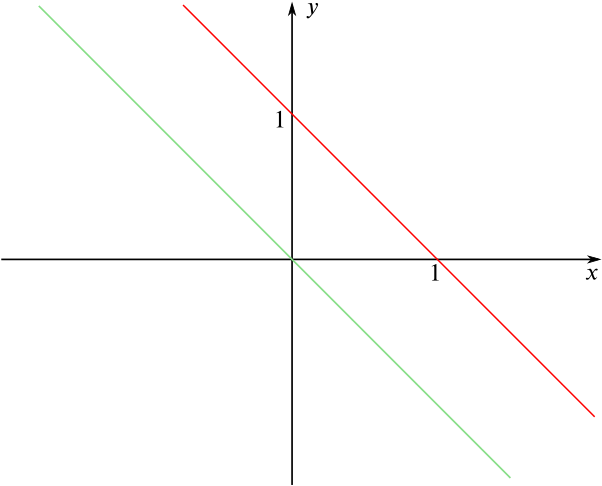
(You might also like to look at the graphs on Desmos.)
What has happened? Can you work out which equations go with which lines? Are there any points missing from the graph? If so, where should they be?
Can you think of any other sets of equations that might fool the computer?