Consider the shaded area under each function shown on the cards.
Put the cards in order of size, from smallest to largest in terms of the shaded area.
If we first step back and look at the four cards as a whole we might notice a few helpful things.
Two of the cards contain linear functions—these areas can be calculated exactly.
The other two cards contain a quadratic and cubic function respectively. Calculating these areas exactly is possible but requires some tools that we may not yet be familiar with. We could however start by finding an estimate for the shaded areas. If we are confident that we have a good estimate this may be enough to put the cards in order.
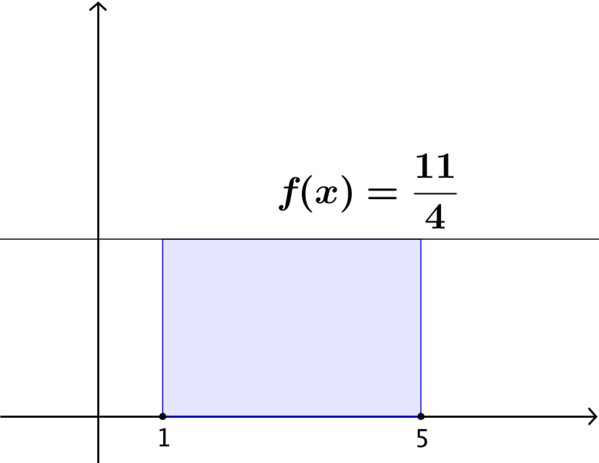
First let’s consider the card containing the linear function \(f(x) = \dfrac{11}{4}\). This function describes a straight line parallel to the \(x\)-axis and therefore the shaded region is a rectangle of width \(4\) and height \(\dfrac{11}{4}\).
The area of this rectangle is then given by \[4 \times \frac{11}{4} = 11.\]
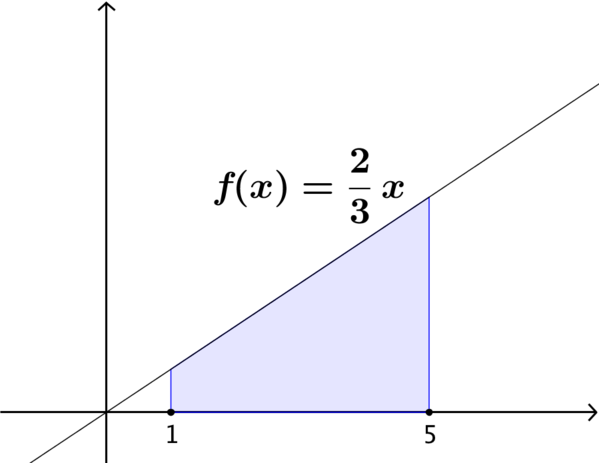
If we now consider the second linear function, \(f(x) = \dfrac{2}{3}x\), we can see that the shaded region is a trapezium.
Do we currently have all of the information needed to be able to calculate the area of this trapezium? If not, how might we determine the additional information?
Once we have calculated a value for this area, is it greater than the area of the shaded region on the previous card?
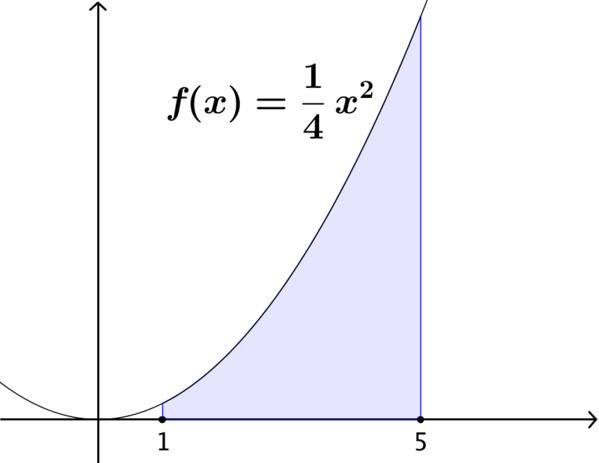
This card shows a quadratic curve. How might we estimate the area of the shaded region?
Is there more than one way in which we could do this?
If we chose to estimate by constructing a trapezium, like this, what would our estimate for the shaded area be? Do you think this estimate is ‘good enough’?
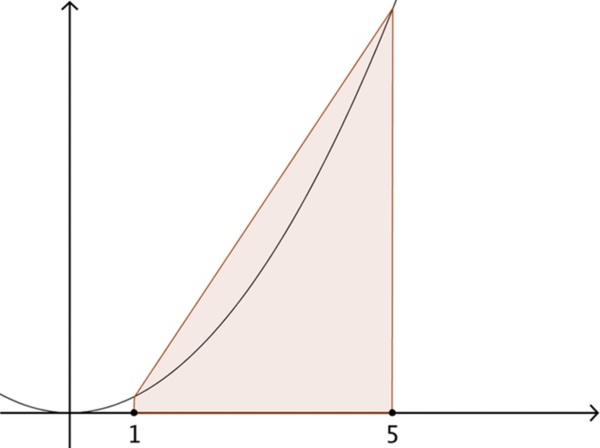
Does our chosen method produce an over-estimate or an under-estimate? How do we know?
Can we establish maximum and minimum values for the shaded area that will enable us to place this card in order, when compared to the previous two?
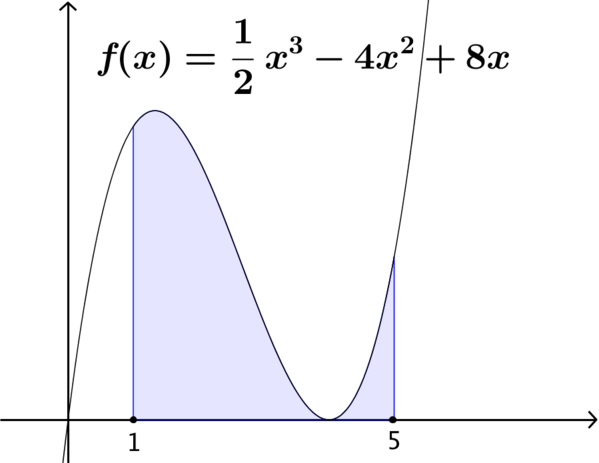
Now we consider the cubic curve on the final card. How might we estimate the area of the shaded region this time?
Will we choose to take the same approach as for the quadratic curve? Why?
Does our chosen method produce an over-estimate or an under-estimate? How do we know?
Can we establish maximum and minimum values for the shaded area that will enable us to place this card in order, when compared to the others?
If you are interested in how the exact answers provided on the problem page were calculated, you might like to explore some of the ideas at Calculus of Powers.