Below is the graph of \(y=3\sin x+4\cos x\).
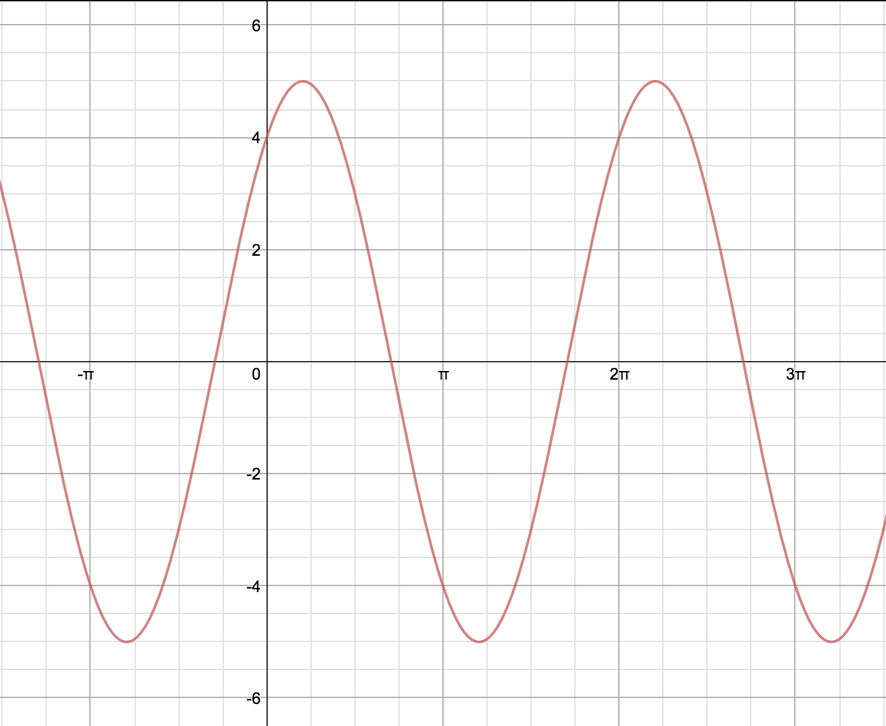
How does this compare with the previous graph?
What function did you use to describe the previous graph?
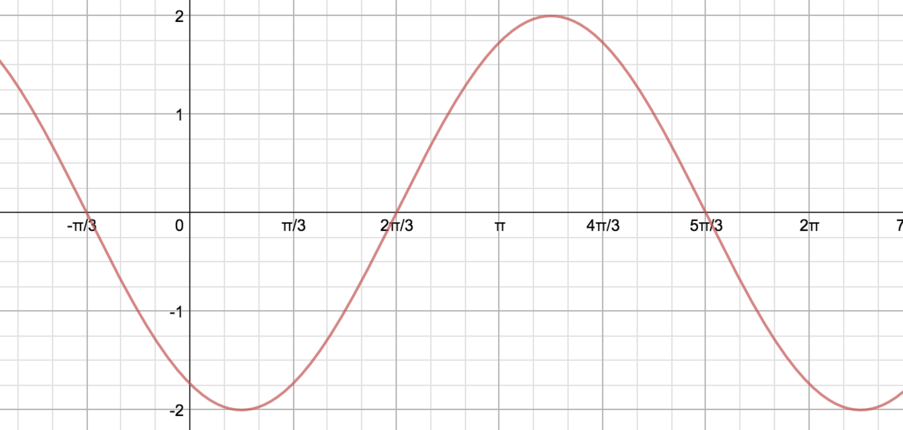
Below are three graphs of similar functions, namely \[y=A\sin x+B\cos x,\] where \(A\) and \(B\) are real numbers.
Can you work out what \(A\) and \(B\) are for each of these graphs?
Can you describe each of them using a single trigonometric function?
You might want to refer back to Things you might have noticed to help with this.
Graph 1
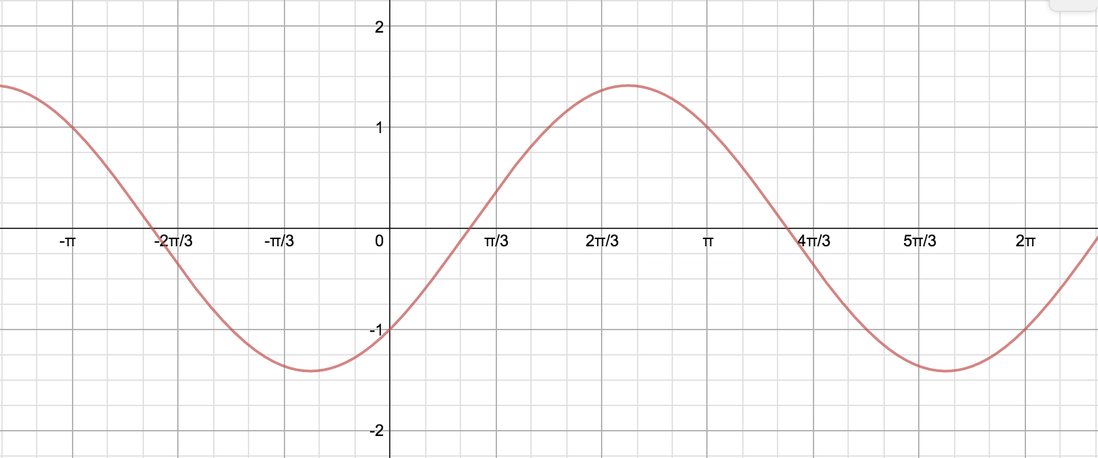
Graph 2
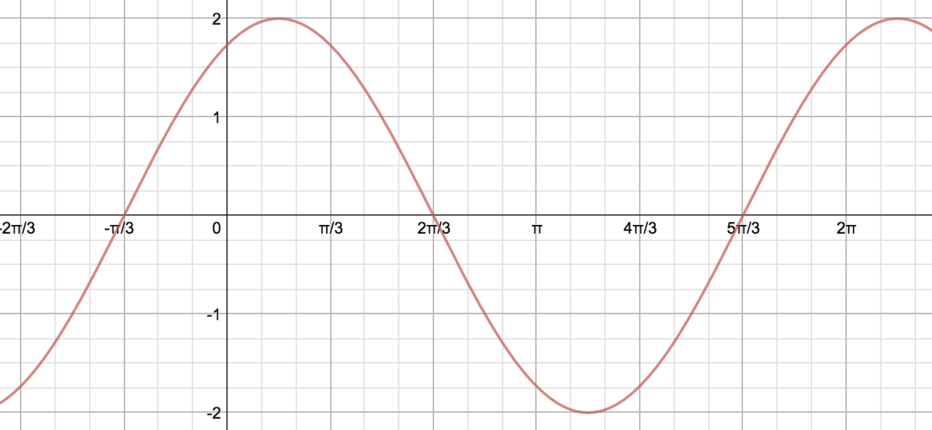
Graph 3