How does this compare with the previous graph?
What function did you use to describe it?
The graphs are identical.
It therefore appears that we can rewrite a function of the form \[A\sin x+B\cos x,\] where \(A\) and \(B\) are real numbers, as \(R\sin(x+\alpha)\) where \(R>0\) and \(0<\alpha<\frac{\pi}{2}\).
Notice here that we found \[\begin{equation} \label{eq:1} 5\sin(x+\alpha) = 3\sin x+4\cos x, \end{equation}\]with \(\frac{\pi}{4}<\alpha<\frac{3\pi}{8}\) from the first problem. The numbers \(3\), \(4\) and \(5\) appear in this equation; does this give you any ideas about a possible relationship between \(A\), \(B\) and \(R\)?
What happens if we substitute different values of \(x\) into this identity?
Substituting \(x=0\) into equation \(\eqref{eq:1}\) gives \(5\sin\alpha=4\) and thus \(\sin\alpha=\frac{4}{5}\).
Below are three graphs of similar functions, namely \[y=A\sin x+B\cos x,\] where \(A\) and \(B\) are real numbers.
Can you work out what \(A\) and \(B\) are for each of these graphs?
Can you describe each of them using a single trigonometric function?
The question here is, how can we use the graphs and our knowledge of sine and cosine functions to find the values \(A\), \(B\), \(R\) and \(\alpha\)?
What does \(A\sin x+B\cos x\) tell us when \(x=0\) and when \(x=\frac{\pi}{2}\)?
Graph 1
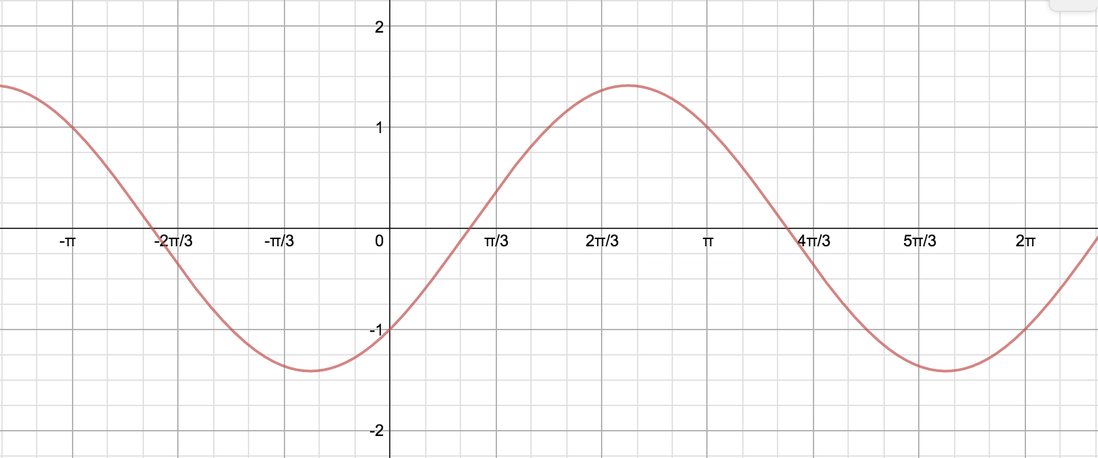
From the graph we can see that when \(x=0\), \(A\sin x+B\cos x=-1\). This means that \(B=-1\).
When \(x=\frac{\pi}{2}\), \(A\sin x-1\cos x=1\) and thus \(A=1\). Hence we have one way of writing this function: \[y=\sin x-\cos x.\]
To write it as a single trigonometric function, we note this this looks like a sine graph which has been translated to the right by a little less than \(\frac{\pi}{3}\), so we could write it in the form \(y=R\sin(x-\alpha)\), where \(R>0\) and \(0<\alpha<\frac{\pi}{2}\).
Our initial idea that we could write a function of the form \(A\sin x+B\cos x\) as \(R\sin(x+\alpha)\), where \(R>0\) and \(0<\alpha<\frac{\pi}{2}\), therefore turns out to not be quite correct: we may have to translate the sine graph in the opposite direction. So maybe we can always write \(A\sin x+B\cos x\) as \(R\sin(x+\alpha)\) where \(R>0\) and \(-\frac{\pi}{2}<\alpha<\frac{\pi}{2}\)?
This new idea is certainly better; is it now correct, or does it need further modification?
Mathematicians frequently have initial ideas and then work to refine them by testing their ideas out with several well-chosen examples. These examples are designed to find the flaws in their initial ideas, which may sound a bit strange at first: don’t you want to show that your ideas work by finding lots of nice examples? Well, yes, but you also need to check that they doesn’t break on nasty ones!
We already know that our function is \(y=\sin x-\cos x\), and so we could begin by looking to work out \(\alpha\).
Starting with \[R\sin(x-\alpha)=\sin x -\cos x,\] we see that if we substitute \(x=\alpha\), then the left hand side is zero, and so we must have \(\sin\alpha=\cos\alpha\). As we are looking for \(0<\alpha<\frac{\pi}{2}\), this gives us \(\alpha=\frac{\pi}{4}\).
We now have \(R\sin(x-\frac{\pi}{4})=\sin x-\cos x\). How can we find \(R\)?
If we substitute in \(x=0\), we end up with something very nice, just as we did earlier: \[R\sin(-\tfrac{\pi}{4})=-1.\] Since \(\sin(-\frac{\pi}{4})=-\frac{1}{\sqrt{2}}\), we deduce that \(R=\sqrt{2}\), hence \[y=\sin x-\cos x=\sqrt{2}\sin(x-\tfrac{\pi}{4}).\]
Graph 2
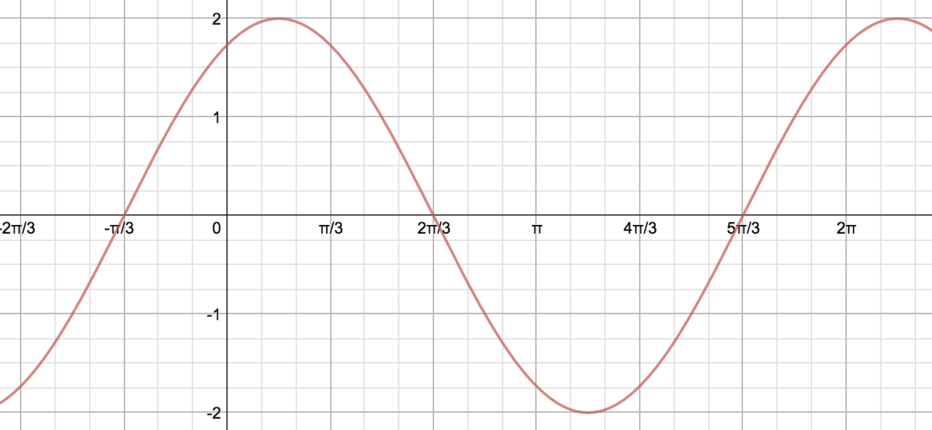
From the graph we can see that when \(x=\frac{\pi}{2}\), \(A\sin x+B\cos x=1\), thus \(A=1\).
When \(x=\frac{\pi}{6}\), \(\sin x+B\cos x=2\), so \(\frac{1}{2}+B\frac{\sqrt{3}}{2}=2\) and thus \(B=\sqrt{3}\).
Hence we have one way of writing this function: \[y=\sin x+\sqrt{3}\cos x.\]
The graph also looks like a translated sine graph: it has a maximum value of \(2\), and has been translated \(\frac{\pi}{3}\) to the left. So we can also write it as \[y=2\sin(x+\tfrac{\pi}{3}).\]
Alternatively, we could think of it as a cosine graph shifted to the right by \(\frac{\pi}{6}\), giving \[y=2\cos(x-\tfrac{\pi}{6}).\]
Graph 3
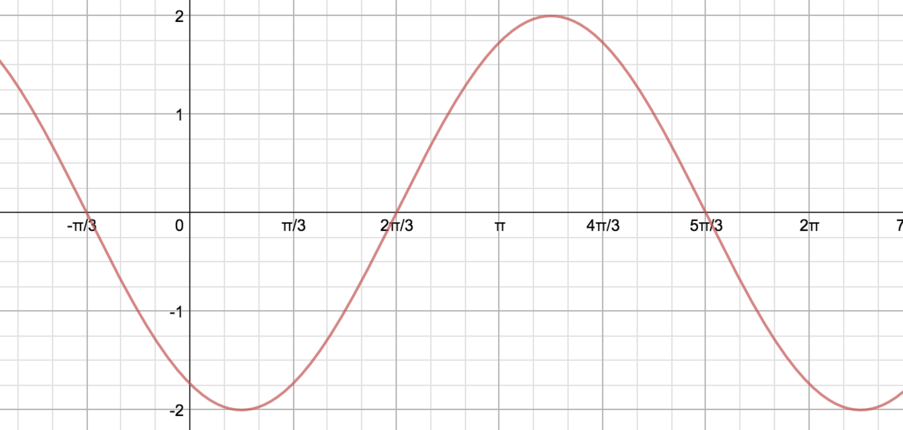
We can see that this graph is just a reflection of Graph 2 in the \(x\)-axis. So we can immediately write down equations for the graph from our equations for Graph 2: \[y=-\sin x-\sqrt{3}\cos x=-2\sin(x+\tfrac{\pi}{3})=-2\cos(x-\tfrac{\pi}{6}).\]