What do your favourite song, the plane that took you on holiday, and the GPS on your phone all have in common? They all involve waves or oscillations: the song is made from sound waves, the aircraft’s wings vibrate, and the GPS function uses radio waves from GPS satellites. There are many more waves around you: water waves, microwaves, the regular fluctuation of animal populations, light—the list is almost endless. The most important tools for scientists and engineers to study those oscillations are the trigonometric sine and cosine functions.
But how can that be? The graphs of the sine and cosine functions are fixed. How can they be used to describe all the different kinds of waveforms that occur in the world around us?
First of all, notice that we can change the shape of a sine (or cosine) wave by including constants in the algebraic expression that represents them.
Consider the graph of \(y = \sin x\). What effect does multiplying \(\sin{x}\) by a constant \(k\) have on the graph?
Consider the graph of \(y = \sin x\). What effect does multiplying the variable \(x\) by a constant \(k\) have on the graph?
Consider the graph of \(y = \sin x\). What effect does adding a constant \(k\) to the variable \(x\) before applying the sine function have on the graph?
Using a combination of all three gives us quite a lot of room for variation.
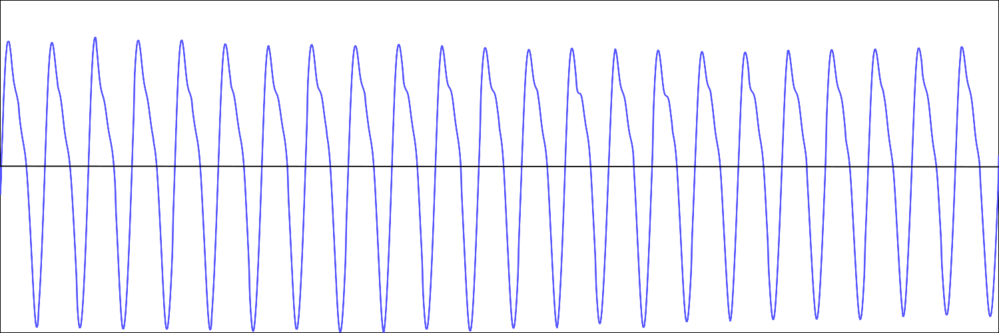
But still, this doesn’t seem to be enough. When we record a note played on a recorder (an A in this case) and look at a graphical representation of that sound, we see that it looks much more jagged than a pure sine or cosine wave. Here you can listen to the note and see its graph. (You can download this recording from the “Extras” on this webpage.) You could also play sounds into software such as the free Audacity to generate graphical representations yourself.

That’s because the recorder doesn’t produce a pure top A, but also a range of other notes called harmonics. Similarly, the vibrations of an aircraft wing or a car component aren’t always smooth and regular, and radio signals from satellites are often corrupted and scrambled up by random interferences.
But, rather amazingly, we can still capture those more complicated waveforms using our familiar trigonometric functions. At the beginning of the 19th century, the French mathematician Joseph Fourier showed that any reasonably nice periodic function can be written as a (possibly infinite) sum of sine and cosine functions.
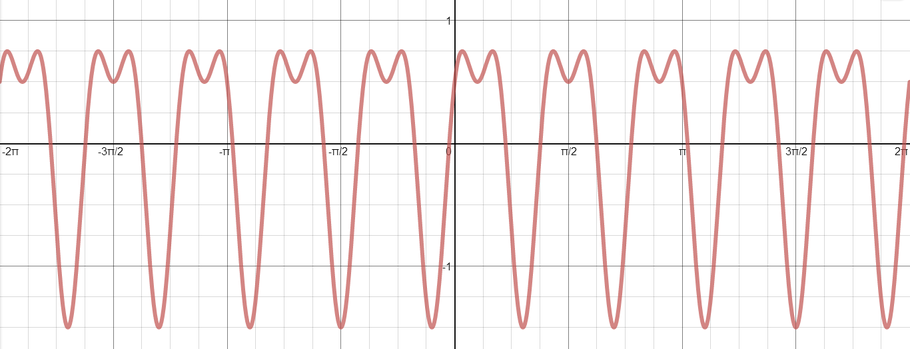
The graph below shows the graph of \(f(x) = \sin{ax}+b\cos{cx}\). Using Desmos (or other graphing software), explore what other waveforms arise with functions of this form.

Can you determine the values of \(a\), \(b\) and \(c\) for the graph shown?
Even the square wave and sawtooth wave can be expressed as a sum of nicely undulating sine and cosine waves, only this time the sum is infinite. The (green) curve in the animation below is what we get by adding more and more sine terms. As we add more terms, it tends towards the square wave (in red). Individual terms in the infinite sum are of the form \[\frac{1}{k}\sin(2 \pi \nu kt),\] where \(k\) is an odd integer and \(\nu\) is the frequency (the number of square waves per second). For example, the first few terms of the series are \[1\sin(2 \pi \nu t) + \frac{1}{3} \sin(3\times 2 \pi \nu t) + \frac{1}{5} \sin(5\times 2 \pi \nu t) + \dotsb.\]
In the animation below, \(\nu=1\).
For the sawtooth wave, the individual terms in the infinite sum are also of the form \[\frac{1}{k}\sin(2 \pi \nu kt),\] but in this case \(k\) can be any integer (and \(\nu\) still represents the frequency).
What are the first three terms of the function?
The red curve in the animation below is what we get by adding more and more terms, getting closer and closer to the sawtooth curve (in blue).
Non-periodic functions
Even if our function \(f\) isn’t periodic, we can still represent it by a sum of sine and cosine functions, at least on a finite interval.
We write the interval from \(a\) to \(b\), including \(a\) but excluding \(b\), as \([a,b)\).
Here is part of a curve:

Considering only the section of the curve defined on \([a,b)\), we could think of it as a truncated section of a periodic function.

In other words, we can take the graph of our function as defined on \([a,b)\) and reproduce copies of that graph next to each other in both directions.

The result is the sawtooth curve, which is a periodic function that agrees with our original one on the interval \([a,b)\). As Fourier discovered, we can write periodic functions as a sum of sine and cosine functions. This means we can write functions (on a finite interval) as the sum of sines and cosines, since we can always extend them to create a periodic function.
You could also analyse the harmonics which appear in the recorder note played above. If you open the file in Audacity, you can ask the software to “Plot Spectrum…” (in the Analyze menu), which shows which frequencies of sine or cosine waves are needed to create the sound. This is very similar to the display on a Graphic Equalizer.
Trying to work out what combination of sines and cosines are needed to build a periodic function seems very hard, as you may have discovered when trying to answer the questions above. What is amazing is that there is a systematic technique for achieving this, also discovered by Fourier and now known as Fourier analysis. It’s incredibly useful: we can use it in all aspects of sound processing, to analyse light from distant stars, make aircraft safe by keeping vibrations under control, decode radio signals from GPS satellites, process images, understand the motion of earthquakes, and to reconstruct the inside of a person’s body from an MRI scan, to name just a few applications. Some people say that Fourier analysis is one of the most useful bits of maths ever discovered—you can see why!


