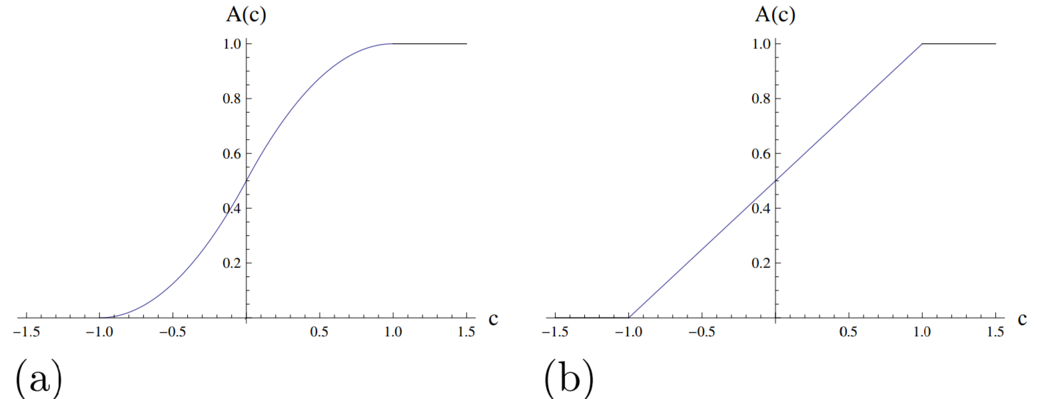
Shown below is a diagram of the square with vertices \((0, 0), (0, 1), (1, 1), (1, 0)\) and the line \(y = x+c\). The shaded region is the region of the square which lies below the line; this shaded region has area \(A(c)\).
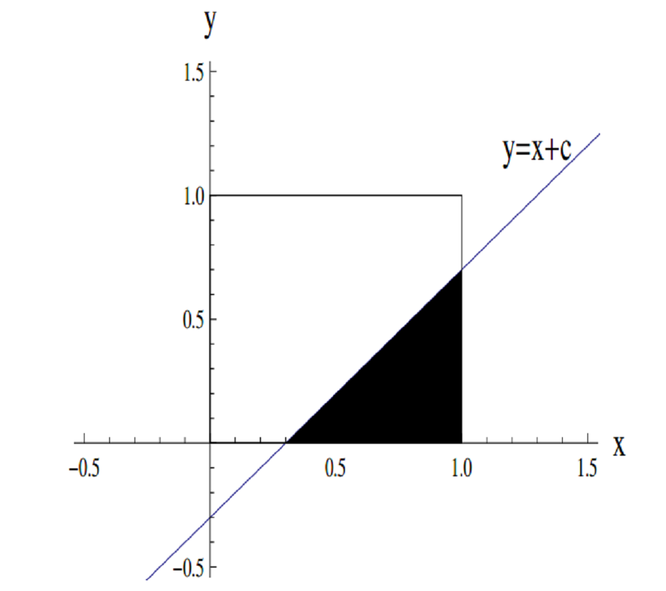
Which of the following graphs shows \(A(c)\) as \(c\) varies?