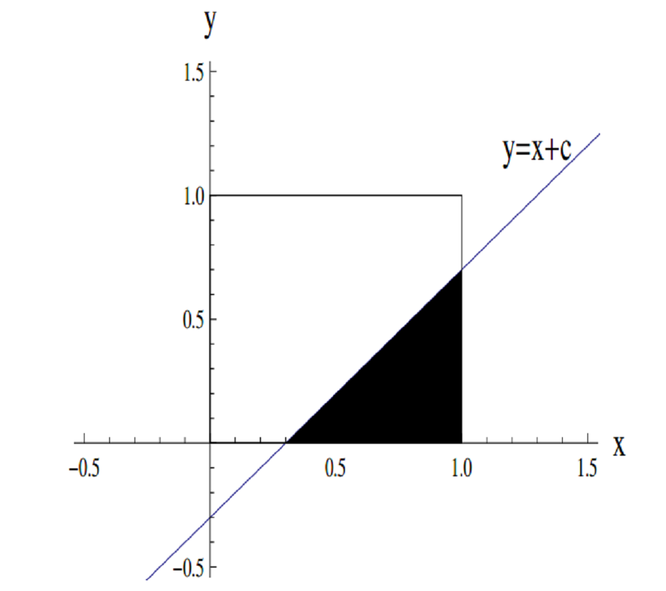
Shown below is a diagram of the square with vertices \((0, 0), (0, 1), (1, 1), (1, 0)\) and the line \(y = x+c\). The shaded region is the region of the square which lies below the line; this shaded region has area \(A(c)\).
What values of \(c\) give a positive area?
When will the area be growing quickly and when slowly?
Which of the graphs given are in line with this?
Alternatively; can we come up with an explicit formula for \(A(c)\), one that tells us what \(A(c)\) is terms of \(c\)?
Could we consider the two cases \(-1 \leq c \leq 0\) and \(0 \leq c \leq 1\) separately?
What shape would the graph of such a formula be?