Shown below is a diagram of the square with vertices \((0, 0), (0, 1), (1, 1), (1, 0)\) and the line \(y = x+c\). The shaded region is the region of the square which lies below the line; this shaded region has area \(A(c)\).
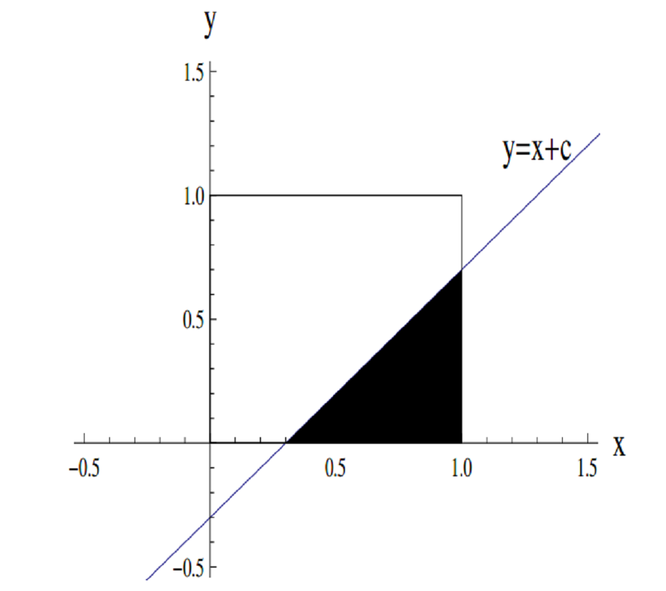
Which of the following graphs shows \(A(c)\) as \(c\) varies?
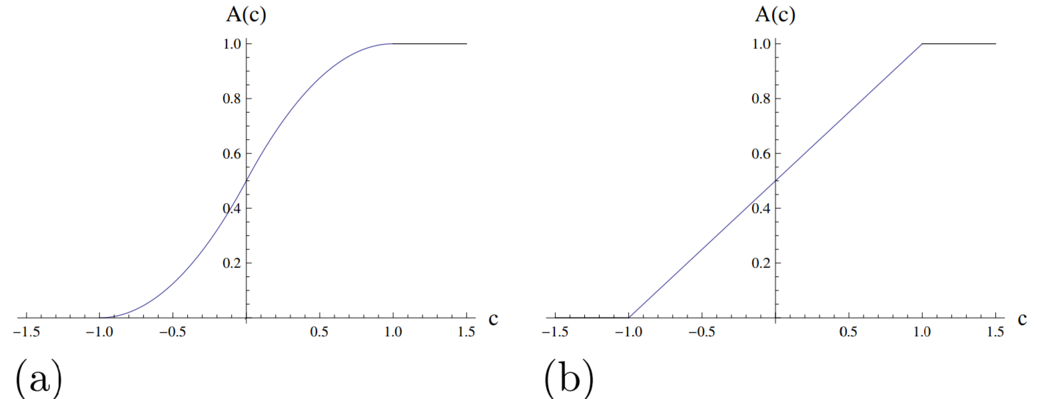
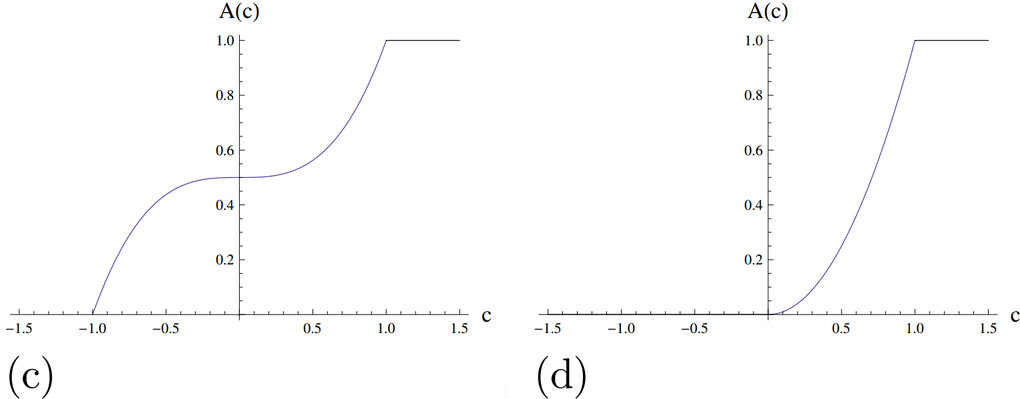
The area \(A(c)\) is first positive once \(c\) becomes greater than \(−1\), which is when the line \(y = x + c\) first touches the square.
As \(c\) increases, the area increases more and more quickly (as more of the line \(y = x + c\) lies within the square) until \(c = 0\) (when \(y = x\) is a diagonal of the square).
The area then increases more and more slowly until \(c = 1,\) at which point \(A(c)\) reaches its maximum value.
The graph with this shape is (a).
Algebraically, looking at the areas of triangles, when \(-1 \leq c \leq 0\), we have \[A(c) = \dfrac{1}{2}(1+c)^2,\] and when \(0 \leq c \leq 1\), we have \[A(c) = 1-\dfrac{1}{2}(1-c)^2 = c+\dfrac{1}{2} -\dfrac{c^2}{2}.\]
Thus for \(-1 \leq c \leq 0\), we have part of a vertex-down parabola, while for \(0 \leq c \leq 1\), we have part of a vertex-up parabola.
The only possible answer is (a).