We usually think of using the trapezium rule when we know what the function is or have a scale on the axes, but what can you say when you don’t have this information?
For each of the graphs we’ve given, what would happen if you used the trapezium rule to estimate the area between the curve and the \(x\)-axis?
You could start by trying to decide for each graph whether the trapezium rule will give you an underestimate or an overestimate. The graphs are available to print out and you may find it helpful to draw on them. You could also cut them up and sort them if you wish.
There are many things to notice about these graphs and how the area between the curve and the \(x\)-axis could be approximated using the trapezium rule. We’ve suggested trying to decide about under or over estimates because thinking about this may spark other ideas or questions. Keep a note of these so that you can investigate them further.
Things to think about
Does the trapezium rule ever give you the exact area?
Do your answers depend on which part of the curve you’re interested in?
Do your answers depend on how many intervals you use?
Here are some things you might have noticed about some of the graphs.
One thing to notice is that for the straight line graphs (graphs 12 and 8) the area between the graph and the \(x\)-axis is either a rectangle or a triangle, so using the trapezium rule for any section of the \(x\)-axis would give us the exact area.
The shapes of Graphs 11 and 2 mean that the trapezium rule can only give an underestimate for the area between the curve and the \(x\)-axis, no matter how many intervals we use. In both cases, the estimate will improve if we use more intervals because the regions between the curve and the trapezia will get smaller. For example,
You may have started to look more closely at which way the curves are curving (whether the gradients are getting steeper or shallower). Can you say anything specific about this yet?
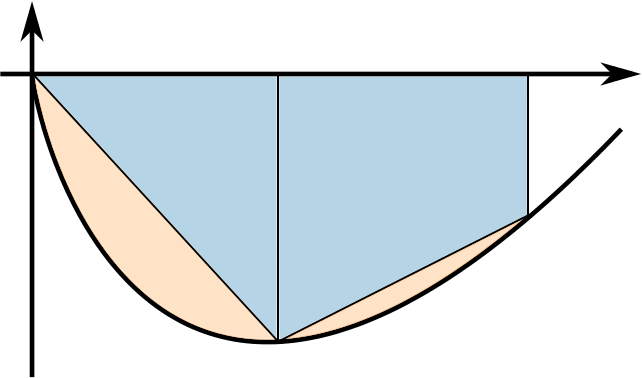
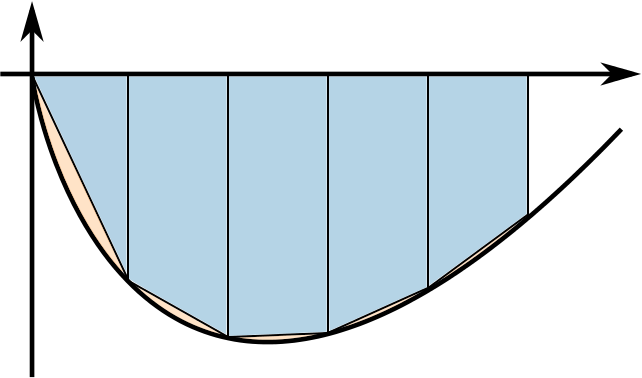
Here are a few ways to use the trapezium rule for Graph 3. What can you say about the area given by the trapezium rule in each case?


When you’re thinking about these graphs, you may find it helpful to consider which of your ideas are specific to Graph 3 and which could be applied to other graphs. Similarly, you might like to think about which things are specific to the way that the trapezium rule has been used in each case.