Here is a map showing the Serpentine Lake in London. It is claimed that the Serpentine covers an area of \(40\) acres. How can you test this?
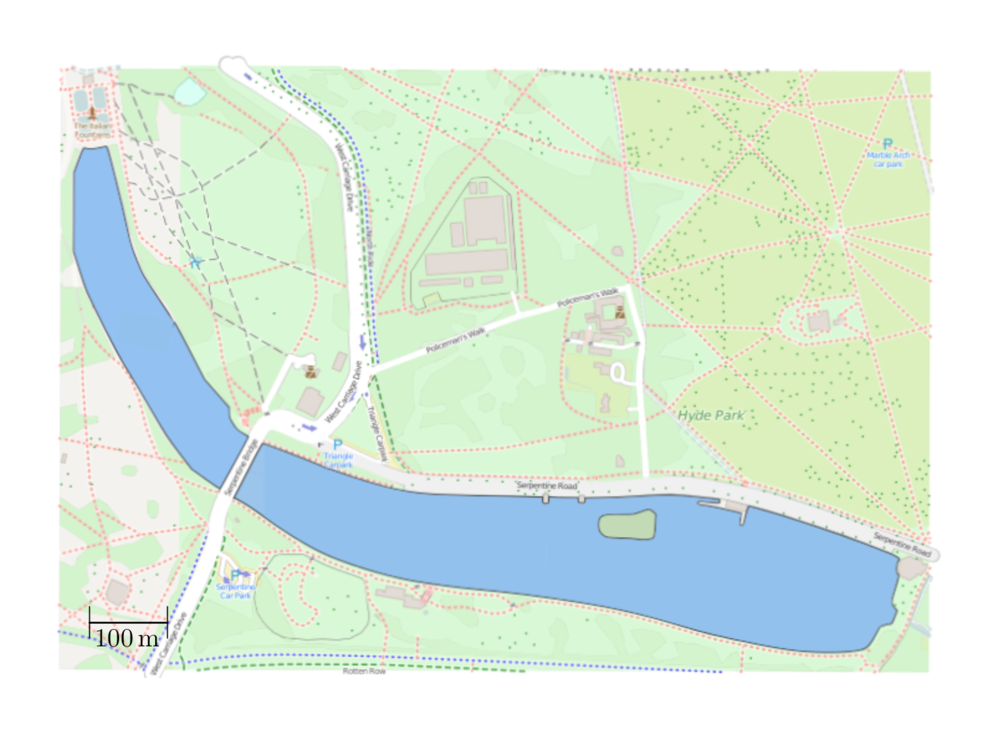
In the warm-up we were able to approximate part of the lake using a rectangle. This was a good enough estimate to show that the claim is talking about the area of the whole lake, but might not be good enough to check whether \(40\) acres is a reasonable estimate. Here are some things we can do to find the approximate area of the lake and test the claim.
Simplify the shape
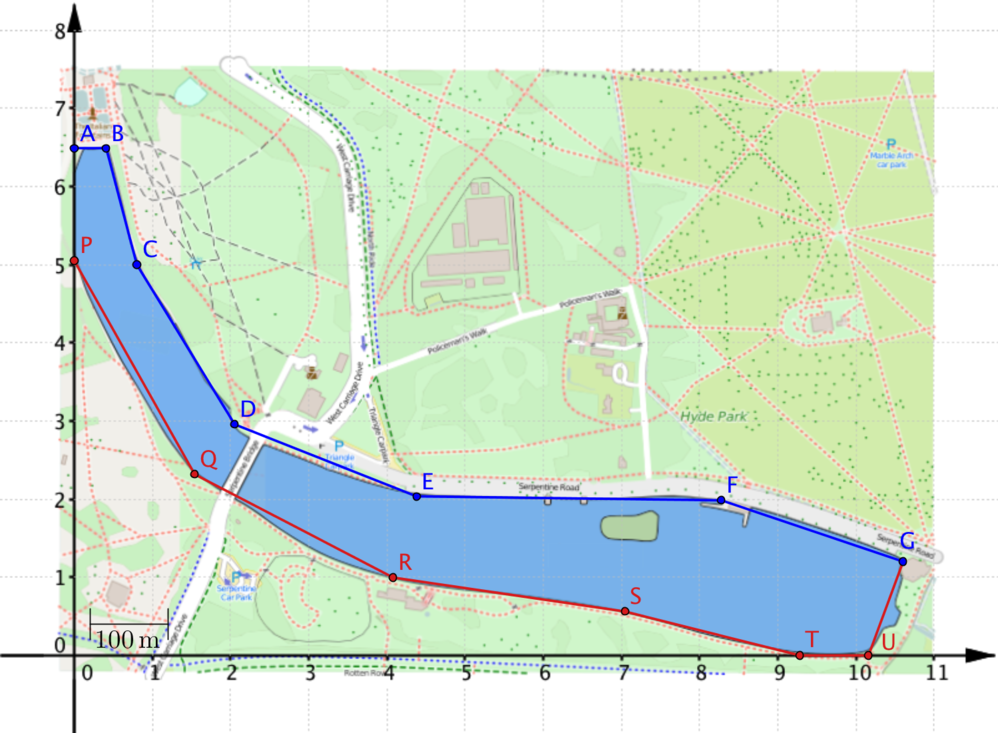
One problem is that the lake has a curved boundary. However, we can approximate the shape of the lake by joining up points on the boundary using straight-line segments. We can then use several triangles or quadrilaterals to approximate the area of the shape.
Use coordinates
To avoid lots of measurements, we can draw axes on the map and use the coordinates of the points on the boundary in our calculations.
Look at the shape differently
As suggested above, to find the area of the lake we could split the shape up into smaller shapes, but this could involve lots of calculations to find the area of irregular shapes. We can think of the boundary of the lake as having an upper part (formed by joining points A,B,…,G and marked in blue on the diagram above) and a lower part (formed by joining points P,Q,…,U,G and marked in red). To find the area between the upper and lower parts of the boundary we could find the area between the blue boundary and the \(x\)-axis and subtract the area between the red boundary and the \(x\)-axis.
Viewing the region we want as a difference between two other regions may seem to make the problem more complicated, but it actually makes it simpler. Can you think of other situations in mathematics where you have made a problem simpler by writing something as a difference of two things you can work out?
Splitting up the shapes
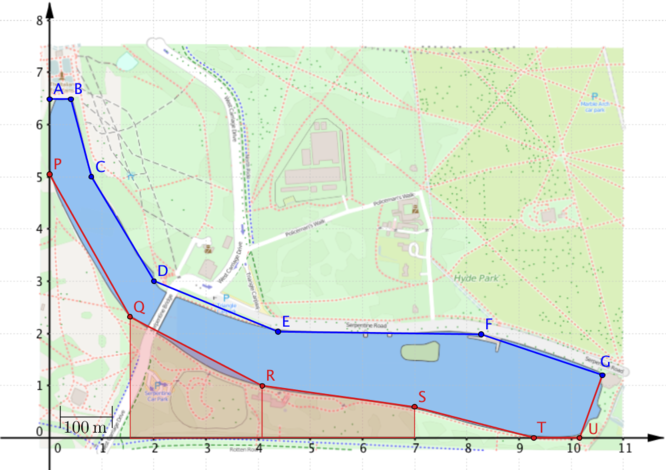
We’ve approximated the boundaries using straight line segments, so we can slice the regions into trapezia such as those shown.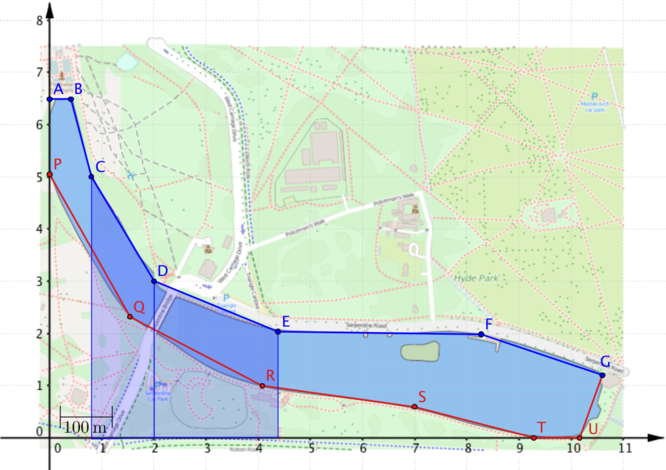
- Why is it helpful to split the region we want into trapezia?
- How do the coordinates of the points on the boundary help?
Is the area of the Serpentine really \(40\) acres?
We have provided a copy of the map with the axes drawn on it. Use the ideas discussed here to decide whether \(40\) acres is a good estimate for the lake size. How could you develop these ideas to find a systematic way to approximate the area of irregular shapes like this.
- Does it matter if the trapezia have different widths?
- What happens if the trapezia all have the same width?
- What happens if the blue and red points occur in pairs with the same \(x\)-coordinates?
- How will the number of trapezia affect the approximation?