In Discussing distance we mentioned speed and velocity. Average speed is the rate your distance changes in a set period of time, for example \(\quantity{50}{km}\) in \(1\) hour. If you walk to school you will speed up, slow down, perhaps even stop. Your speed will not stay the same, but we can talk about your average speed for the trip.
Velocity is similar but, like displacement, also depends on direction. If you average \(\quantity{3}{km/h}\) on your walk to school, and walk home in the same amount of time, your velocity for the return part of your journey would be \(\quantity{-3}{km/h}\).
Both displacement and velocity involve two pieces of information. How far (or fast) you travel, and the direction. Quantities like this are known as vectors.
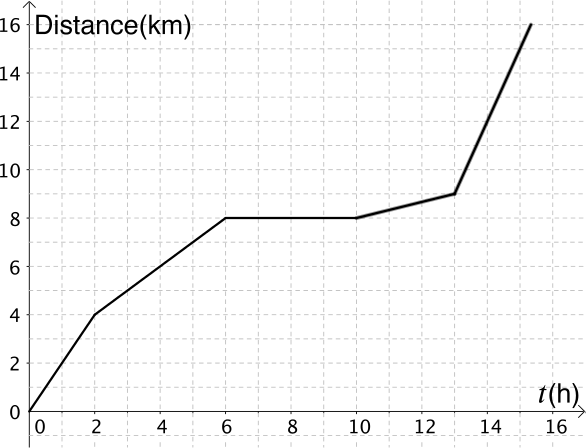
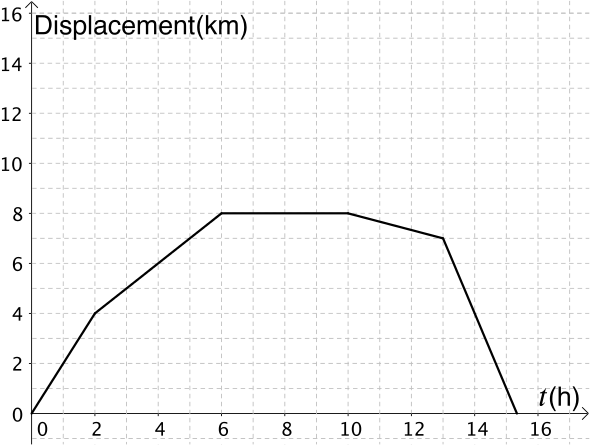
- Try to sketch the speed-time graph and the velocity-time graph from these distance and displacement graphs of the same journey. Think about how you will work out the speeds and velocities. Will you use a formula? Or can you use features from the graphs?
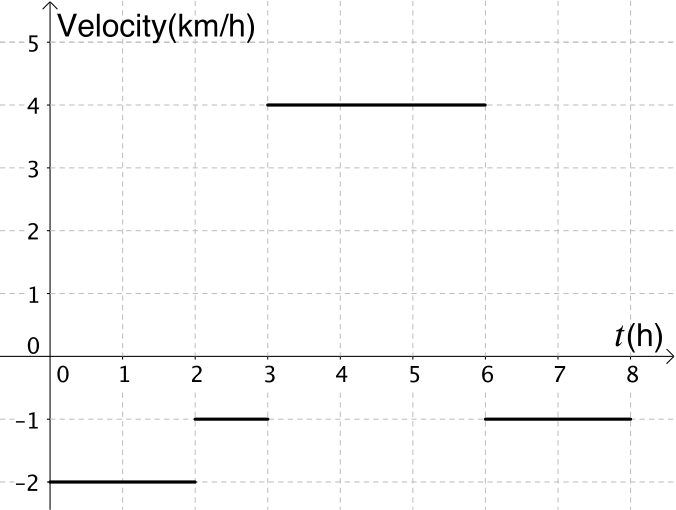
- Given this velocity-time graph below, can you sketch the displacement-time graph?