The journey described by our velocity-time graph was along a straight road.
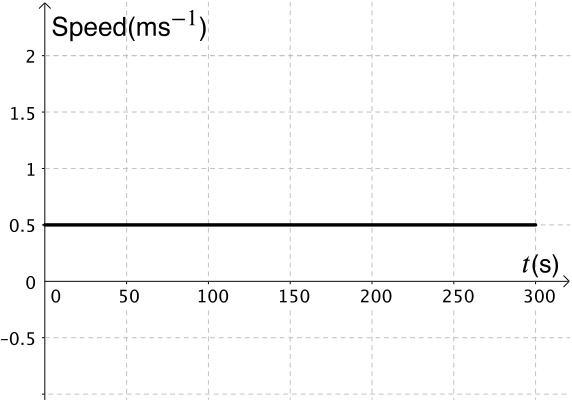
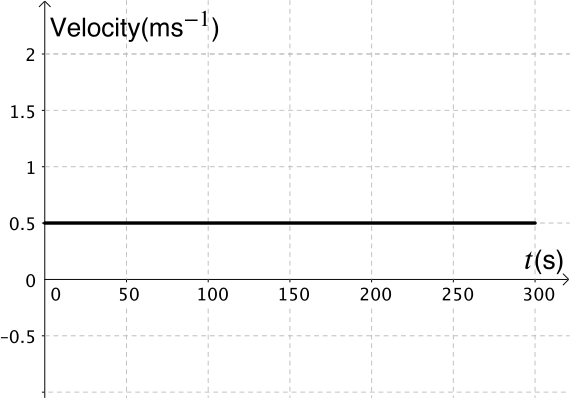
For each of the situations below, can you sketch a speed-time graph and a velocity-time graph?
Do the graphs look the same?
Are they both possible to draw?
Situation one
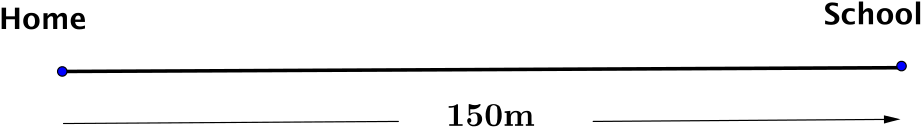
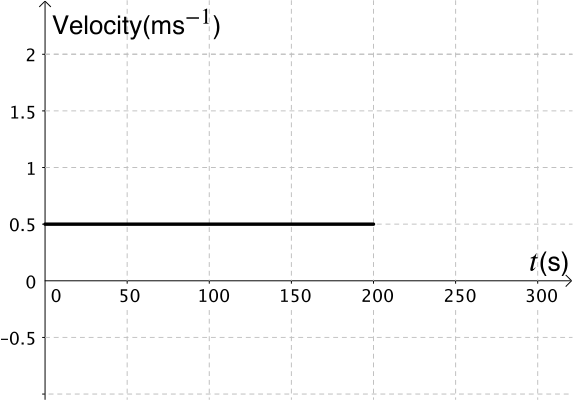
You walk straight to school travelling at a constant speed of \(\quantity{0.5}{m\,s^{-1}}\).
Situation two
You walk straight along the road from home to school and at the end of the first road you take a \(90^{\circ}\) turn left. You travel at a constant speed of \(\quantity{0.5}{m\,s^{-1}}\).
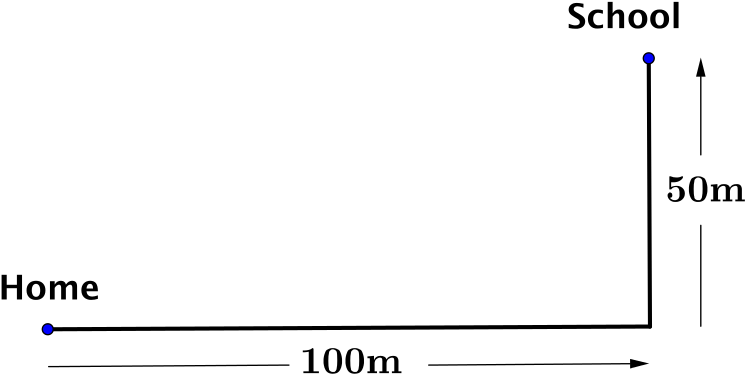
At faster speeds we would expect to slow down when we approach and turn a corner. Here we are making the assumption that the constant speed of \(\quantity{0.5}{m\,s^{-1}}\) is maintained.
We have seen that journeys in one dimension can easily be represented on displacement-time and velocity-time graphs. However it is not possible to represent journeys in two dimensions in the same way. In order to work with journeys in two (or more) dimensions we use vectors.