- Try to sketch the speed-time graph and the velocity-time graph from our distance and displacement graphs of the same journey. Think about how you will work out the speeds and velocities. Will you use a formula? Or can you use features from the graphs?
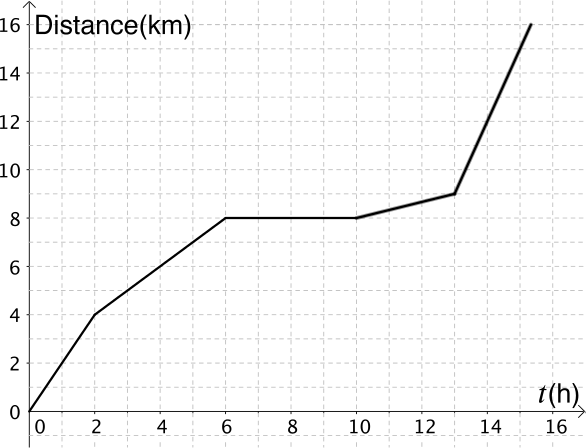
The formula we could use is \[\textrm{average speed} = \dfrac{\textrm{change in distance}}{\textrm{change in time}}.\] Given that the axes are distance and time, this is also a formula for the gradient. Therefore the speed and velocity can be found by looking at the gradient of each section of the graph.
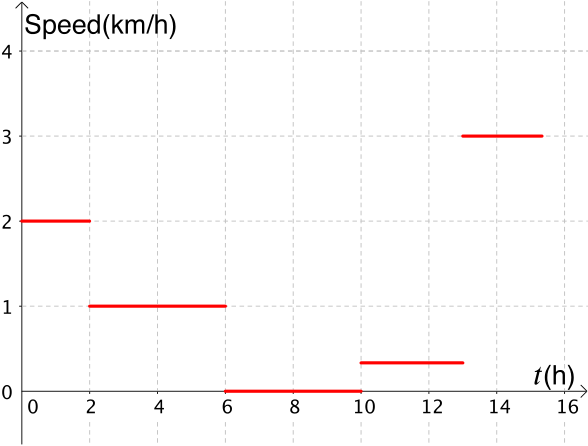
Distance and speed
Remember, displacement is the distance away from your initial point of measurement. The journey these graphs are based on, from Discussing distance was along a straight road. If the road curved instead, would you get the same graphs for distance and displacement?
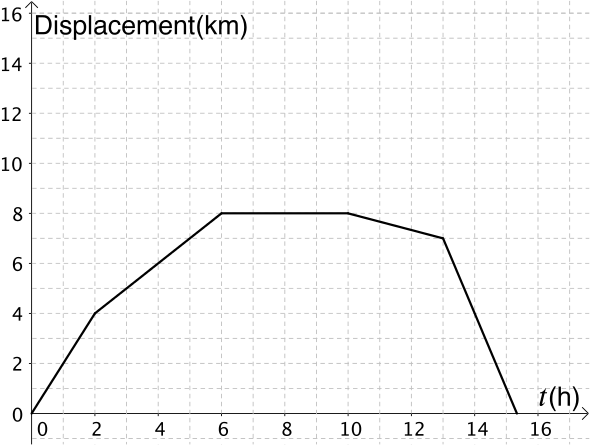
Displacement and velocity
Both our graphs for speed and velocity look quite unusual. Here are some more things to think about before you move on.
- Do you think these graphs could come from a journey in the real world?
- Why are the separate pieces of the graphs not joined up?
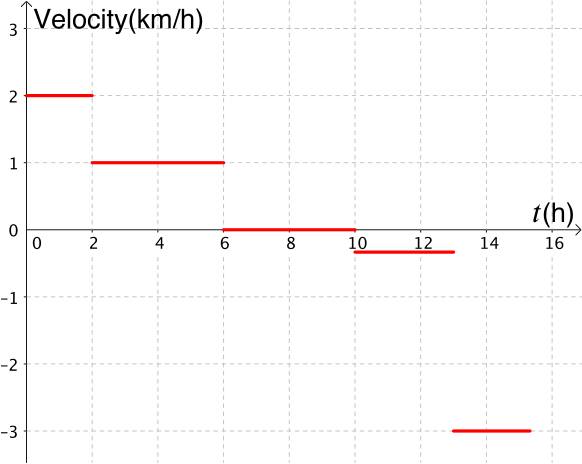
- Given the velocity-time graph below, can you sketch the displacement-time graph?
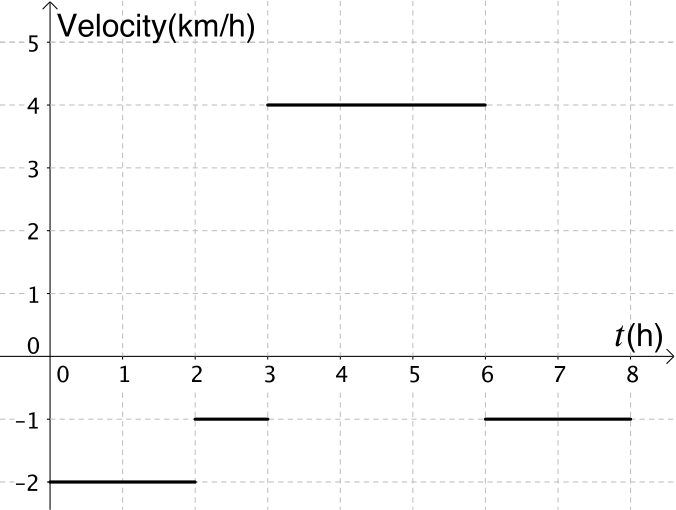
If we look at the first section on the graph, we know the velocity is \(\quantity{-2}{km/h}\) for \(2\) hours.
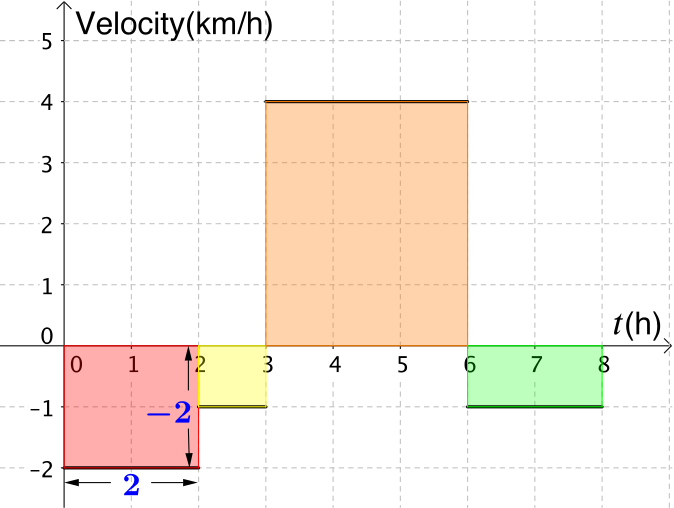
As \(\textrm{velocity}=\dfrac{\textrm{displacement}}{\textrm{time}}\), the displacement will be \(-2 \times 2 = -\quantity{4}{km}\).
Let’s think about what this answer means. \(\quantity{-4}{km}\) is travelled during the first \(2\) hours. For example, if we are walking along a straight road and we measure positive displacement in one direction, then \(\quantity{4}{km}\) has been travelled in the opposite direction.
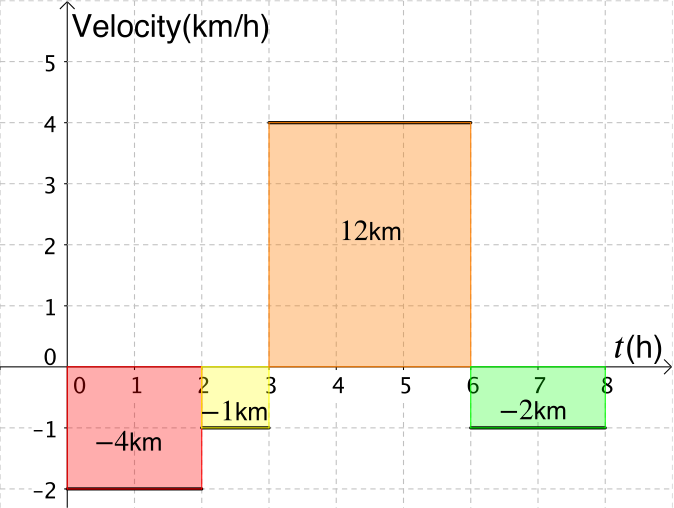
We can work out the displacement for each of the sections on the graph. What is the link between the displacement and the rectangles drawn for each section of the graph?
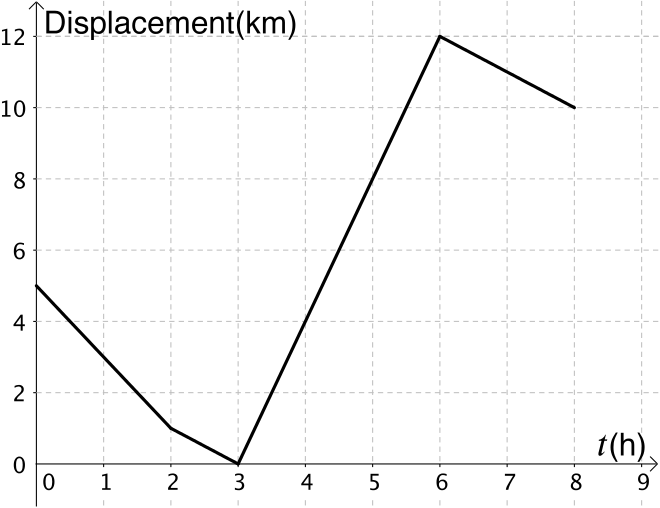
Now we need to put this information on to a displacement-time graph. Does this match what you have drawn?
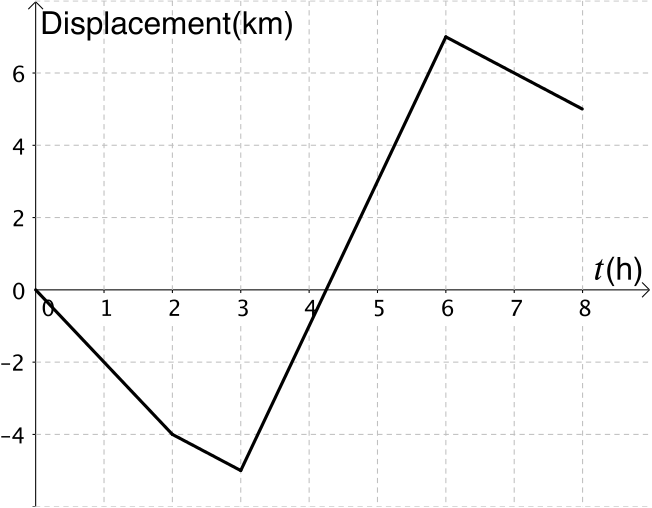
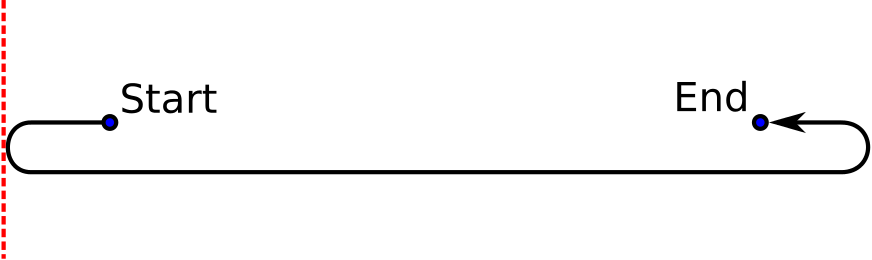
This graph represents our journey when we are measuring displacement from our starting point which could be the dotted line in the diagram below.
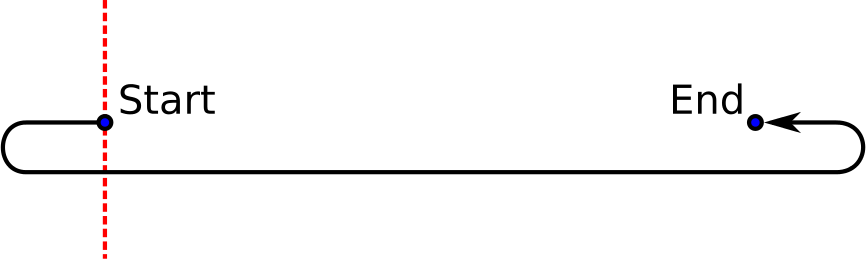
However, we don’t actually know where the displacement was measured from. If the same journey had its displacement measured from where the dotted line is now, what would the graph look like?
All the journeys that have been explored here involved moving at constant speeds or velocities for intervals of time. For example, we could say that after \(5\) hours they were travelling at \(\quantity{4}{km/h}\). This is not an average speed but their actual speed.
In reality, we rarely travel at a constant speed and it is very difficult to measure actual or instantaneous speed. One of the best things we can do is to take average speed over small intervals of time. For very small time intervals, approaching zero, we can think about the idea of instantaneous speed.