We are now going to try to draw diagrams that represent the situations we have just thought about. If we return to our example, we asked ‘What colour is the car?’ about all the cars in the UK.
To represent this, we will take our input (all the cars in the UK) and our output (colours), and represent them by the dots in the diagram below.
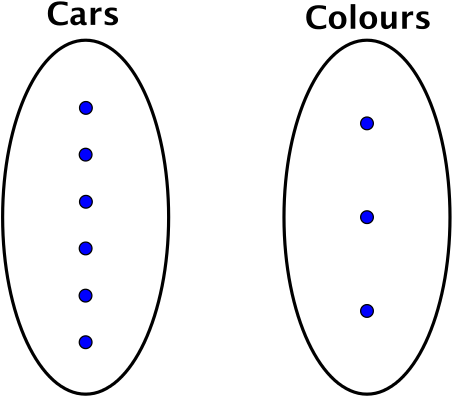
Of course we are not actually showing all cars, or all colours, but rather a representation of the situation.
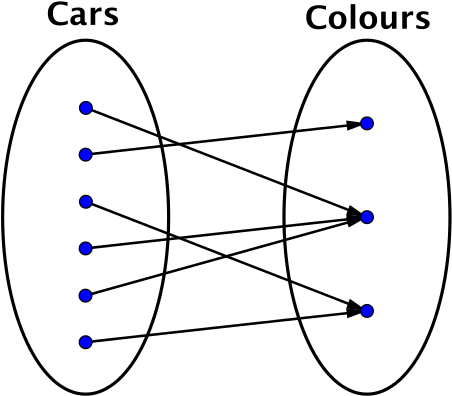
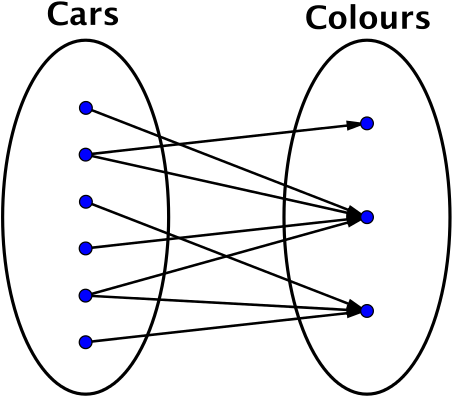
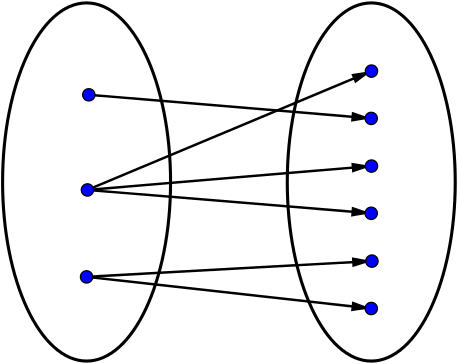
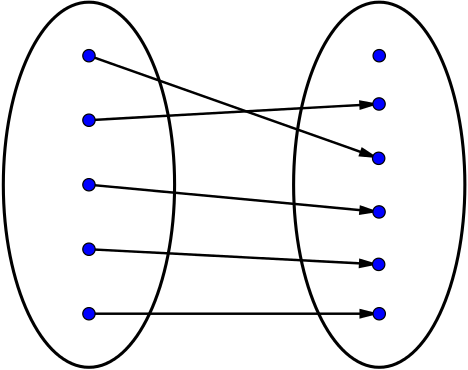
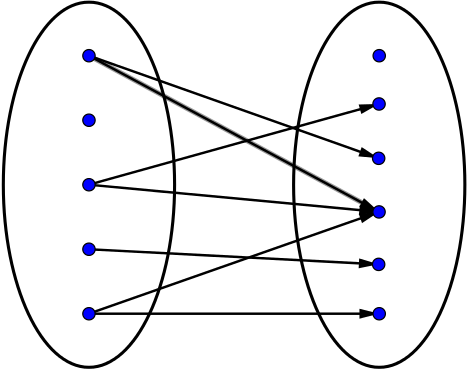
Now if we think about the answers we gave to the three questions, we might draw one of the following:
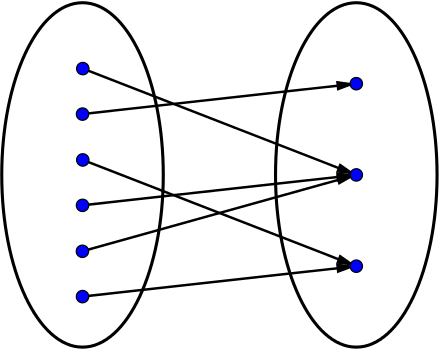
Try to draw similar types of diagrams for the situations you have thought about. We have provided diagrams below that may be helpful. Some may match a situation and some may need to be modified.
Once you have a diagram for each situation, look at the different features of each diagram.
- What do you notice?
- Are there similarities/differences between the situations?
- Can any of them be grouped together because they have certain features?
To explore these groups, look at the next section.