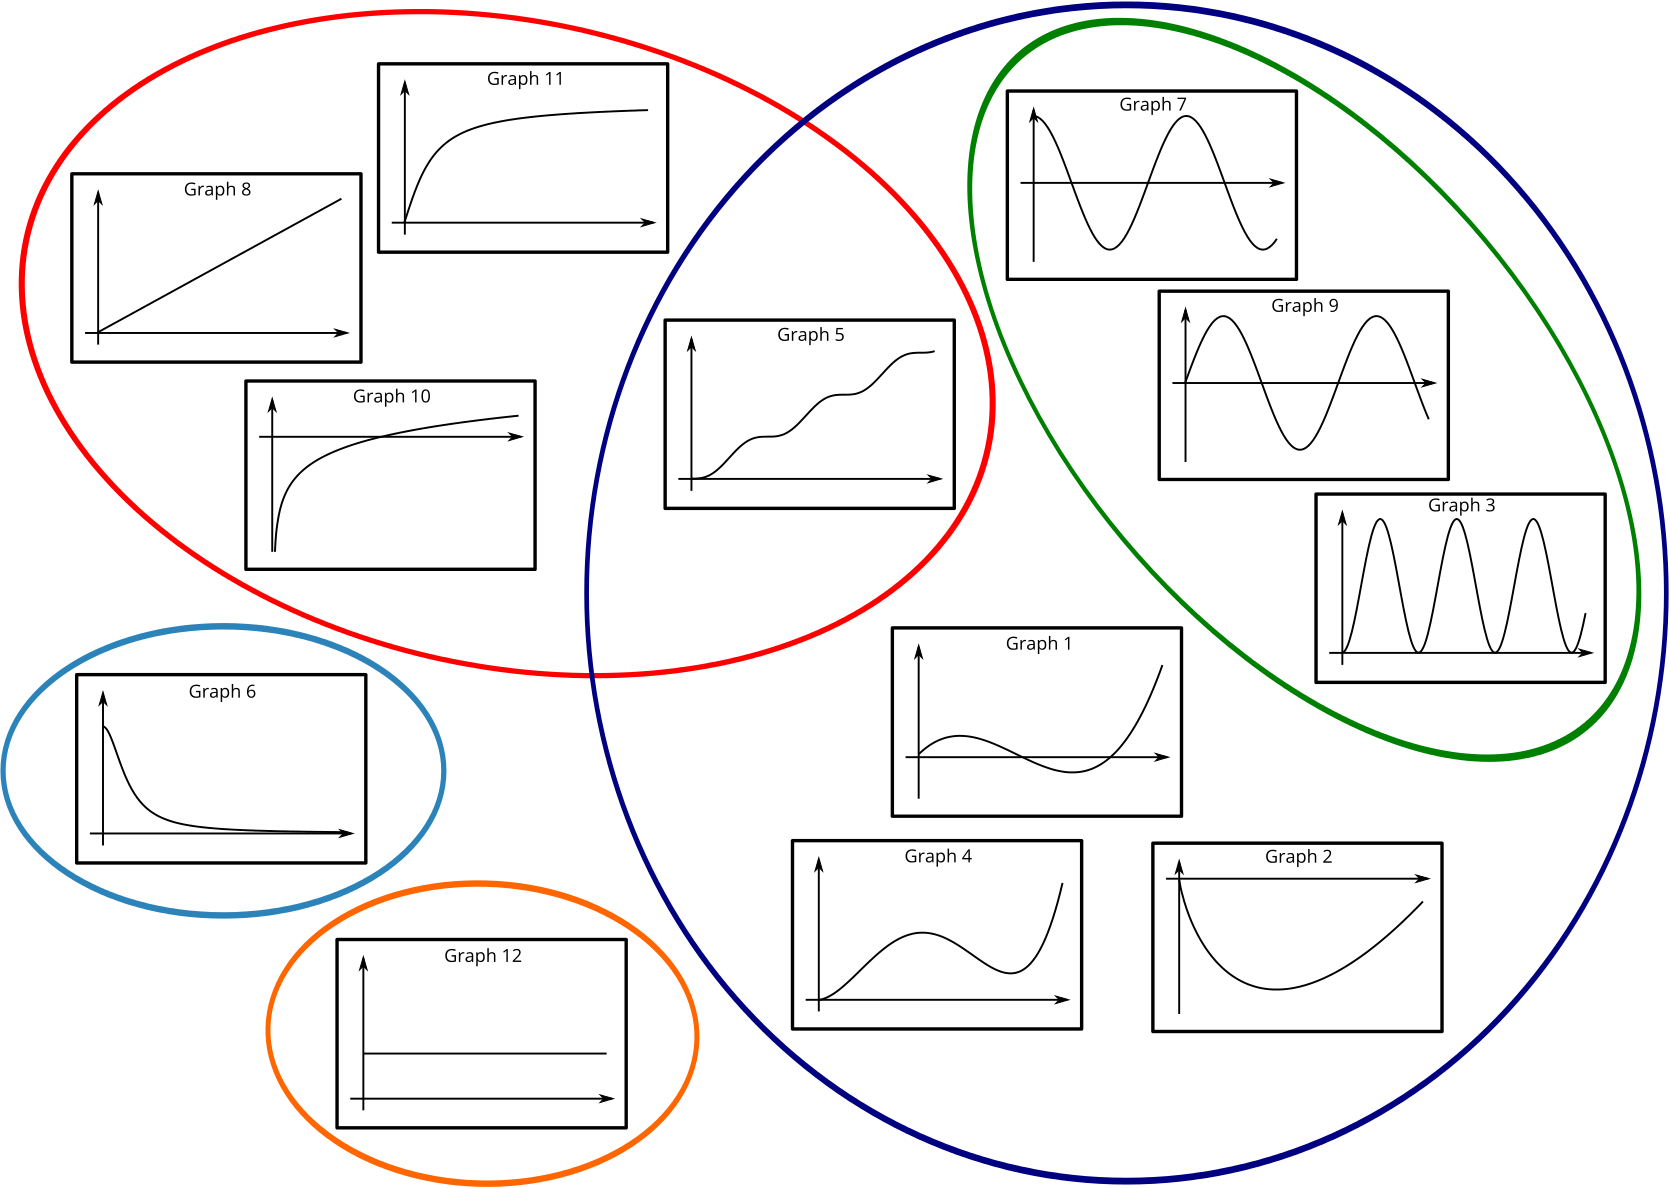
Try to sort these graphs into families.
- How will you choose to define the families?
- Which features of the graphs will you use?
- Are there some graphs which belong to more than one family?
This is a description of the process that led to one way of sorting the graphs. It is definitely not the only way to sort the graphs! You might find it helpful to have the graphs in front of you as you read this.
Stage 1
I started by looking for features that the graphs share. I noticed that graphs 8, 10 and 11 show functions which are always increasing, so I chose “function is always increasing” for my first family of graphs.
I separated the graphs into those that should be in this family (graphs 8, 10 and 11), and those I thought shouldn’t be (graphs 1–4, 6, 7, 9 and 12). I wasn’t sure about graph 5. The function shown appears to have some stationary points, so its derivative is not positive everywhere. Does this mean that the function in graph 5 is not increasing?
What does it mean for a function to be increasing? What conditions must an increasing function satisfy?

We can say that the gradient of graph 5 is non-negative, so is this enough to say that the function is increasing? To look at it another way, let’s call the function \(f.\) It appears from the graph that, for any two input values \(a\) and \(b\), if \(a < b\) then \(f(a) < f(b).\) For these reasons I chose to put graph 5 in the family of increasing functions.
Strictly speaking…
We have said that a function is increasing if, for any two input values \(a\) and \(b\), if \(a < b\) then \(f(a) < f(b).\) The term “strictly increasing” can be used for these functions and we can say that a function is “increasing” if it satisfies the weaker condition that, for any two input values \(a\) and \(b\), if \(a < b\) then \(f(a) \leq f(b).\)
Can you find a graph of an increasing function which is not strictly increasing and the graph of a strictly increasing function?
Can you find graphs of decreasing and strictly decreasing functions?
Stage 2
Thinking about graph 5 gave me a second feature to use for sorting: I used “has at least one stationary point”. This separated graph 5 from graphs 8, 10 and 11 within the family of increasing functions and separated graphs 1–4, 7 and 9 from graphs 6 and 12 in the “not-increasing” family. On closer inspection, graph 6 didn’t seem to have a stationary point close to the \(y\)-axis and is always decreasing. I also wasn’t sure if the constant function on graph 12 should count as having (infinitely many) stationary points, or none. I chose to separate these functions from the others in the “not-increasing” family using “function is always decreasing” and “function is constant” to define new families.
Stage 3
Finally, I separated graphs 1, 2 and 4 from graphs 3, 7 and 9 because the functions represented by graphs 1, 2 and 4 appear to keep increasing as the input increases (once it has gone past a certain value), whereas the functions represented by graphs 3, 7 and 9 appear to keep oscillating between fixed values.


It is worth pointing out that these decisions were based on the assumption that all the critical features of the functions have been shown on the graph.
Summary
Graphs 8, 10, 11 and 5 all show increasing functions, but graph 5 is the only one of these to have stationary points.
Graphs 1–4, 6, 7, 9, 12 do not show increasing functions. Of these, only graph 6 shows a function which is always decreasing and only graph 12 shows a constant function. All the others have stationary points.
Within the family of functions which are not increasing but have stationary points (graphs 1–4, 7 and 9) we can separate graphs 3, 7 and 9 because these show functions which oscillate between fixed values.

How would these families be different if I had started by thinking about stationary points?
How would these families be different if I had used the condition \(f(a)\leq f(b)\) if \(a<b\) to choose my first family of graphs?

