We have drawn the graphs of two functions, \(f(x)\) and \(g(x)\). In each case we have drawn the graph of the gradient function below the graph of the function. Try to sketch the graph of the gradient function of the gradient function. You may find it helpful to think about how features of the function relate to features of its gradient function.
Now compare your sketch of \(y=f''(x)\) with the graph of \(y=f(x).\) Do the same for \(y=g''(x)\) and \(y=g(x).\)
- What do you notice?
- How are features of the second derivative related to features of the original function?
It is difficult to get more information than where the second derivatives are positive or negative or cross the \(x\)-axis, so your graphs of \(f''(x)\) and \(g''(x)\) may not look quite like the ones we’ve drawn.
Comparing graphs
The function \(f'(x)\) is always increasing, but it increases less rapidly as \(x\) increases. Therefore \(f''(x)\) is always positive, but decreasing.
Comparing the graphs of \(f''(x)\) and \(f(x)\), we can note that \(f''(x)\) is always positive, and the gradient of the graph of \(f(x)\) is always increasing.
The minimum in \(f(x)\) corresponds to the point where the graph of \(f'(x)\) crosses the \(x\)-axis, but it doesn’t seem to correspond to any particular feature of the graph of \(f''(x).\)


As \(g'(x)\) increases and decreases repeatedly, it has maxima and minima. At points corresponding to the maxima and minima of \(g'(x)\), \(g''(x)=0\) and changes sign.
The gradient of the graph of \(g'(x)\) is steepest half way between the maxima and minima, so this gives the maxima and minima for \(g''(x).\)
How do the points where \(g''(x)=0\) relate to points to the graph of \(g(x)\)? If we were travelling along the graph of \(g(x)\) as \(x\) increases, we’d be turning to the left, then to the right, and so on. After the origin, the first point where \(g''(x)=0\) corresponds to the first point where the graph of \(g(x)\) stops bending to the left and starts bending to the right. The graph starts bending to the left again at the first stationary point, which gives us the next point where \(g''(x)=0.\) This behaviour is repeated as we move along the graph.


General observations
As \(x\) increases, the graph of \(g(x)\) curves to the left when \(g''(x)>0\) and curves to the right when \(g''(x)<0.\) If we look back at the graphs of \(f(x)\) and \(f''(x)\) we see that the graph of \(f(x)\) always curves to the left as \(x\) increases and \(f''(x)\) is always positive. The sign of the second derivative tells us the direction in which the graph is curving as \(x\) increases. This is part of the description of curvature. What does this tell you about the sign of the second derivative close to a local maximum or a local minimum?
The points where the graph of a function changes from curving in one direction to curving in the other direction are called points of inflection. As we’ve seen from the case of \(g(x)\), points of inflection can be stationary points, but they don’t have to be. The crucial point is that the second derivative changes sign at the point, but the first derivative does not.
Now try this
For each of the following functions
- Sketch the graph of the function — what does it tell you about the first and second derivatives? Try to sketch these too (without doing any calculations).
- Work out the first and second derivatives and amend your graphs if necessary — what do the first and second derivatives tell you about the original function?
- \(f(x)=1-3x\)
The graph of \(f(x)\) is a straight line with constant negative gradient. Therefore \(f'(x)\) will be a constant negative function and \(f''(x)=0\) for all \(x.\)
If \(f(x)=1-3x\) then \(f'(x)=-3\) and \(f''(x)=0.\) These confirm the ideas above. Note that although \(f''(x)=0\) at every point, it doesn’t change sign anywhere so there are no points of inflection.
- \(g(x)=(x-1)(x+5)\)
The graph of \(g(x)\) has a minimum half-way between the roots. The gradient changes from negative to positive here, so the graph of \(y=g'(x)\) will pass through the point \((-2,0).\) The gradient of \(y=g'(x)\) is always increasing, and the graph of \(y=g(x)\) is always bending to the left as \(x\) increases. Therefore \(g''(x)\) is always positive.
Differentiating gives \(g'(x)=2x+4\) and \(g''(x)=2.\) This confirms the ideas above.
- \(h(x)=x^3-9x\)
The graph of \(h(x)\) crosses the \(x\)-axis when \(x=-3\), \(0\) and \(3.\) There is a maximum between \(x=-3\) and \(x=0\) and a minimum between \(x=0\) and \(x=3\) so \(h(x)\) increases, then decreases, and then increases again. Therefore \(h'(x)\) changes from positive to negative, and then back to positive. Between the two stationary points, the graph of \(h(x)\) changes from curving to the right to curving to the left, so \(y=h(x)\) has a point of inflection. Therefore \(h''(x)\) will change sign once; it will be negative until this sign change, and then positive.
Differentiating gives \(h'(x)=3x^2-9\) and \(h''(x)=6x.\) Once again, this confirms our ideas. As \(h'(0)=-9\), the point of inflection is not a stationary point.
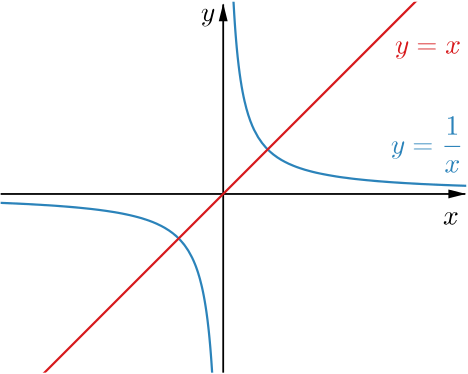
- \(k(x)=x+\dfrac{1}{x}\)
This function may not be familiar, but it is the sum of two functions we know a lot about. It may be helpful to sketch graphs of \(y=x\) and \(y=\tfrac{1}{x}\) on the same axes.
 What does this tell you about \(k(x)\) when \(x\) is positive? What happens when \(x\) is close to \(0\) or when \(x\) is very large? What about when \(x\) is negative?
A rough sketch of \(k(x)\) suggests that \(k'(x)\) will be negative close to the \(y\)-axis and become positive as \(x\) moves away from \(0\) in either direction.
Differentiating gives \(k'(x) = 1-\dfrac{1}{x^2}\) so the graph of \(k'(x)\) is symmetric about the \(y\)-axis.
 The value of \(k'(x)\) is a large negative number when \(x\) is close to \(0\), but \(k'(x)\) gets closer to \(1\) as \(x\) moves away from \(0.\) We expected the value of \(k'(x)\) to be positive if \(x\) is large and positive or large and negative, but how could you use \(k(x)\) to explain why \(k'(x)\) approaches \(1\)?
The equation \(k'(x)=0\) has two solutions. What does this tell you about stationary points of \(k(x)\)?
As \(x\) increases from \(0\), the gradient of \(y=k'(x)\) is positive and decreases to \(0.\) What happens when \(x\) is negative? What does this tell you about the graph of \(k''(x)\)?
 Differentiating again gives \(k''(x)=\dfrac{2}{x^{3}}.\) This behaves in the way we expected from the analysis of \(k'(x).\) Note that \(k''(x)\) changes sign when \(x=0\), but \(y=k(x)\) does not have a point of inflection here because \(k(0)\) is not defined.
If \(x>0\) then \(k''(x)>0\) so this portion of \(y=k(x)\) turns to the left as \(x\) increases. What happens for negative \(x\)?
Does this information about \(k'(x)\) and \(k''(x)\) confirm your initial ideas about the graph of \(y=x+\dfrac{1}{x}\)?