This is the graph of \(y=\log_{5} x\)
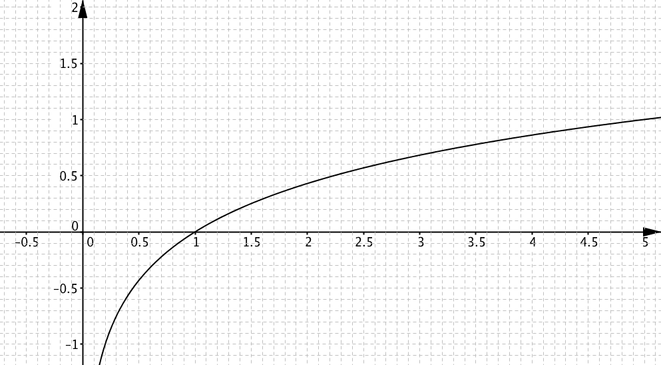
Use this graph to help you to draw graphs of
- \(\log_{25}x\)
- \(\log_{\sqrt{5}}x\)
- \(\log_{\frac{1}{5}}x\)
- \(\log_{10} x\)
- \(\log_{x} 5\)
Try to make your graphs as accurate as you can, but use the graph of \(y=\log_{5}x\) to help you, rather than a calculator.
Here are graphs 1 and 2 drawn using values from the \(y=\log_{5}x\). The relationships between each graph and the graph of \(y=\log_{5}x\) are described below.
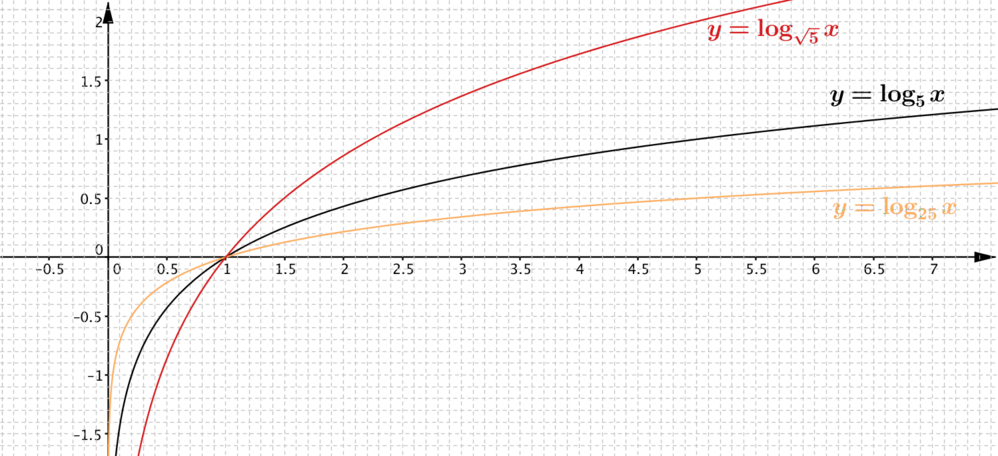
\(\log_{25} x = (\log_{25} 5)(\log_{5} x) = \frac{1}{2}\log_{5} x\), so the graph of \(y = \log_{25} x\) is a stretch of the graph \(y=\log_{5}x\) parallel to the \(y\)-axis and scale factor \(\frac{1}{2}\).
\(\log_{\sqrt{5}}x= (\log_{\sqrt{5}} 5)(\log_{5} x)=2\log_{5} x\), so the graph of \(y=\log_{\sqrt{5}}x\) is a stretch of the graph \(y=\log_{5}x\) parallel to the \(y\)-axis and scale factor \(2\).
Thinking about the definition of logarithms, as we did in the warm-up, these results make sense. For example, we’d expect the power that we’d raise \(5\) to in order to get a given value of \(x\) to be twice as much as the power we’d need to raise \(25\) to.
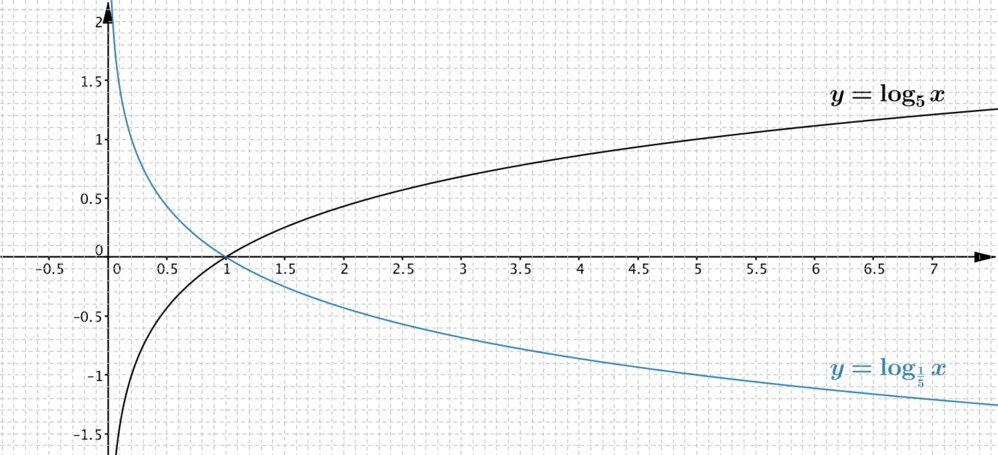
- As \(\dfrac{1}{5} = 5^{-1}\), the power that we’d raise \(\dfrac{1}{5}\) to in order to get a given value of \(x\) is \(-1\) times the power we’d need to raise \(5\) to. Alternatively, using the idea from the warm-up, \[\log_{\frac{1}{5}}x=(\log_{\frac{1}{5}} 5)(\log_{5}x)=-\log_{5}x\] and so the graph of \(y = \log_{\frac{1}{5}}x\) is a reflection in the \(x\)-axis of the graph of \(y=\log_{5}x\).
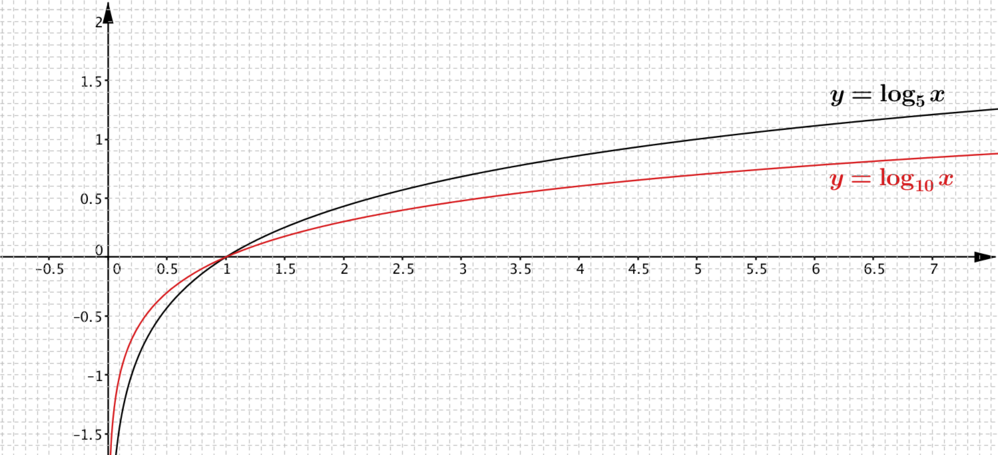
- More work is needed for the graph of \(y=\log_{10} x\). We know that \(\log_{10}x= \dfrac{\log_{5} x}{\log_{5} 10}\), so we need to divide by \(\log_{5}10\) to get the graph of \(y=\log_{10}x\). The given graph doesn’t go up as far as \(x=10\), but \(\log_{5}10 = \log_{5}5+ \log_{5}2 = 1+ \log_{5}2\). From the graph, \(\log_{5} 2 \approx 0.42\). Now, \(1 \div 1.42 = \frac{100}{142}=\frac{50}{71}\approx\frac{49}{70} = 0.7\) so the graph of \(y=\log_{10}x\) is a stretch of \(y=\log_{5}x\) parallel to the \(y\)-axis, scale factor \(0.7\).
- For \(x>0\) with \(x\neq 1\), (\(\log_{5}x)(\log_{x}5)= \log_{5}5=1\), so \(\log_{x}5\) is the reciprocal of \(y=\log_{5}x\). We can use this to plot particular points to get an idea of the shape of the graph \(y=\log_{x}5\).
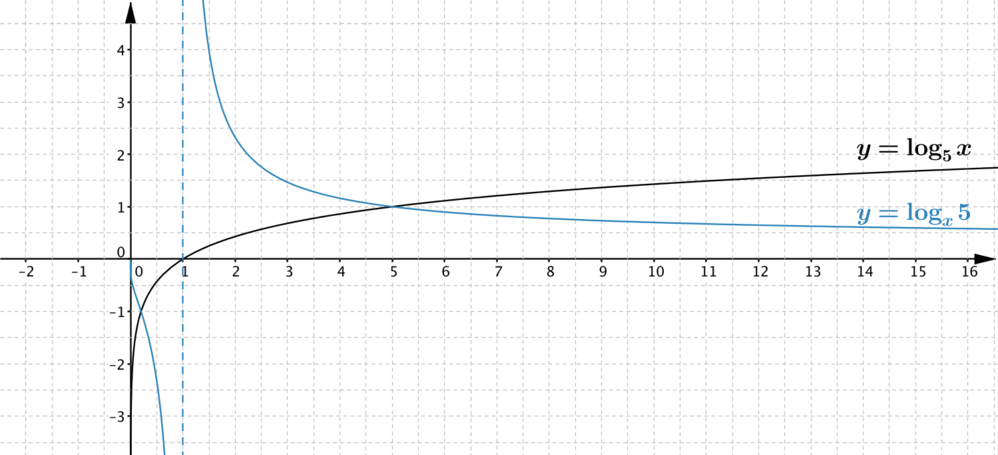
Alternatively, we can use the behaviour of the function \(\log_{5} x\) to sketch the behaviour. For \(x>1\), as \(x\) increases, \(\log_{5}x\) increases and is positive, so \(\log_{x}5\) decreases and is positive. For \(x\) close to \(1\), \(\log_{5} x\) is close to \(0\), and the graph of \(y=\log_{x}5\) has an asymptote at \(x=1\). For \(0< x <1\), \(\log_{5}x\) is negative. It increases to \(0\) as \(x\) increases to \(1\), and tends to \(-\infty\) as \(x\) decreases to \(0\). The graph of \(y=\log_{x}5\) gets steeper and closer to the \(y\)-axis as \(x\) decreases to \(0\), but it doesn’t actually meet the \(y\)-axis because \(\log_{x}5\) isn’t defined for \(x=0\).