Here is a graph of \(y=\log_{5} x\)
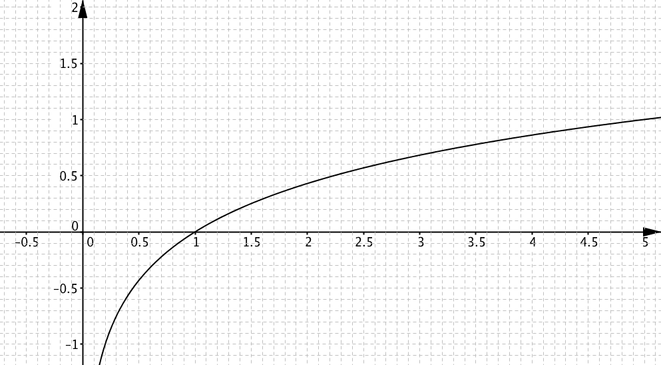
Use this graph of \(y=\log_{5} x\) to help you to draw graphs of
- \(\log_{25}x\)
- \(\log_{\sqrt{5}}x\)
- \(\log_{\frac{1}{5}}x\)
- \(\log_{10} x\)
- \(\log_{x} 5\)
Try to make your graphs as accurate as you can, but use the graph of \(y=\log_{5}x\) to help you, rather than a calculator.
You could try to sketch the graphs first, thinking about which points the graphs go through and which graphs will give larger or smaller values for the same value of \(x\). You may find it helpful to look back at the warm-up.
You can draw your graphs on the printable larger version of the \(y=\log_{5}x\) graph.