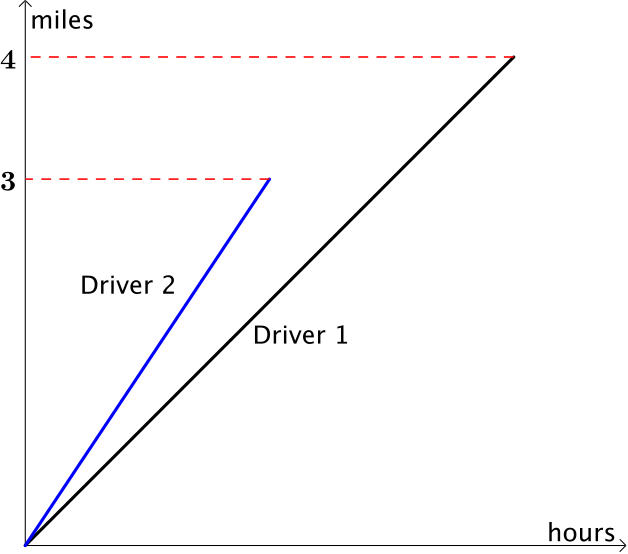
The graph above shows the information we were given in the table, with the speeds of the drivers represented by the gradients of the lines. How can we use it to help us solve the problem?
It is always a good idea to sketch a graph of a situation. It can help you visualise situations, highlight differences and similarities, and offer you a geometric way to solve a problem.
- How far apart will the cars be after the first driver has gone \(\quantity{1}{mile}\)?
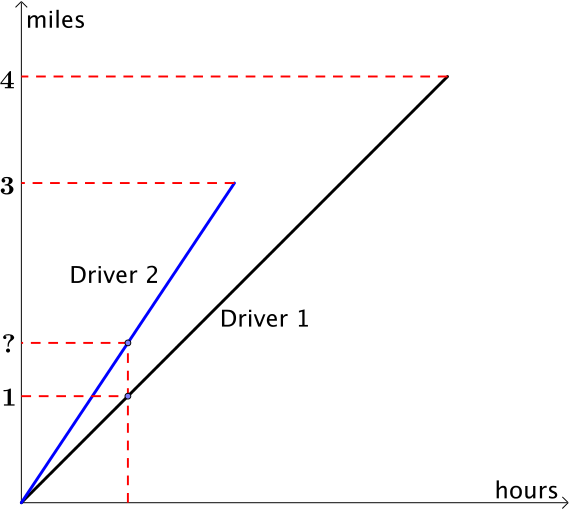
After driving \(\quantity{1}{mile}\) at \(\quantity{50}{mph}\) the first driver has been travelling for \(\dfrac{1}{50}\)th of an hour or \(1.2\) minutes. Therefore the second driver has travelled a distance of \(75\times\dfrac{1}{50} = \quantity{1.5}{miles}\) so the cars are \(\quantity{0.5}{miles}\) apart.
We could also have thought about the ratio of the speeds. The second driver is going \(1\frac{1}{2}\) times as fast as the first driver, so he will travel \(1\frac{1}{2}\) times as far in the same time.
- What will be the greatest distance between the two drivers and when will it occur?
Both drivers arrive at the second speed camera together so we could add in the second driver’s journey to the graph.
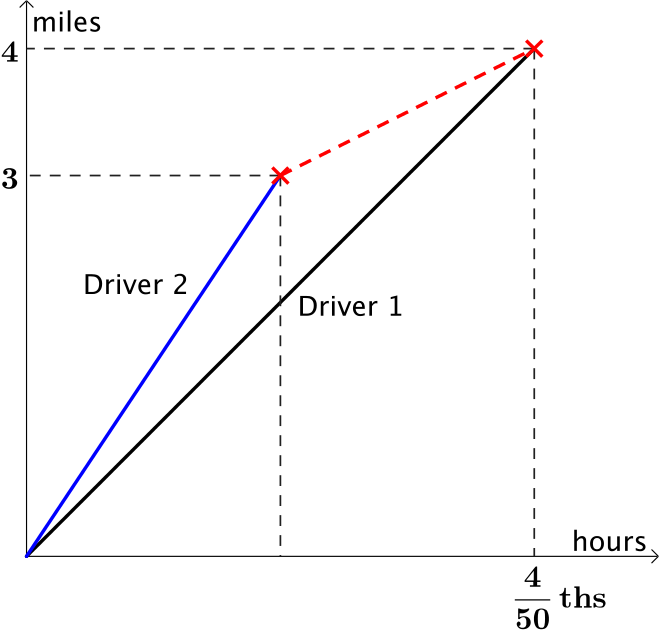
The cars will be the greatest distance away from each other when the second driver has travelled \(\quantity{3}{miles}\). This occurs at \(\dfrac{3}{75}\)ths of an hour or \(2.4\) minutes. In this time, the first driver will have travelled \(50\times\dfrac{3}{75}=\quantity{2}{miles}\). The gap between them will be \(\quantity{1}{mile}\).
- What is the average speed of the second driver?
Both cars travel the same distance in the same amount of time, so the second driver must also be averaging \(50\) mph in the situation above.
- What was the second driver’s speed for the last mile?
The line we have drawn in represents the second part of their journey. The speed of the car is equal to the distance divided by the time taken.
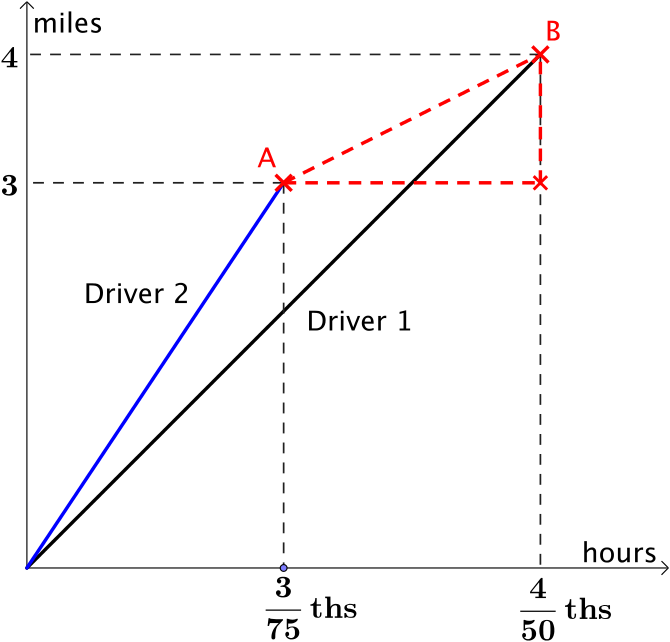
We know the coordinates of A and B so we can calculate the speed as, \[\dfrac{4-3}{\frac{4}{50}-\frac{3}{75}}=\quantity{25}{mph}.\]